
Figure 7.
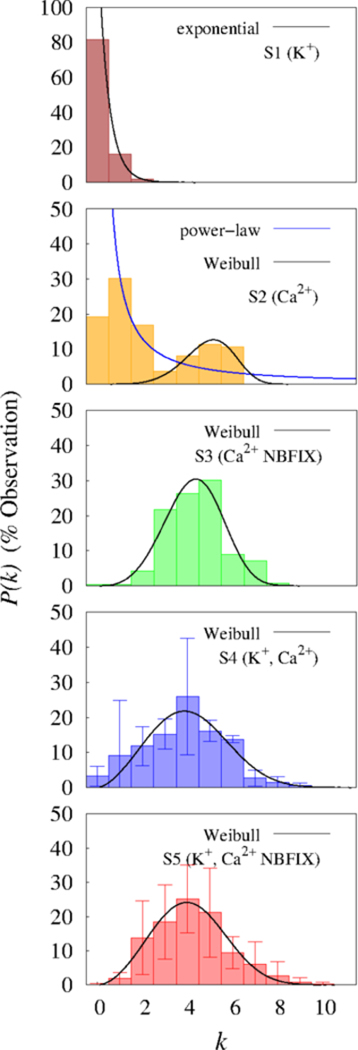
Degree distributions and best statistical fits (for k > 0). The degree distribution P(k) denotes the frequency of occurrence of vertices with degree k between 400 and 600 ns. Results of two cation systems (S4 and S5) were presented as the mean and standard deviation (error bars).