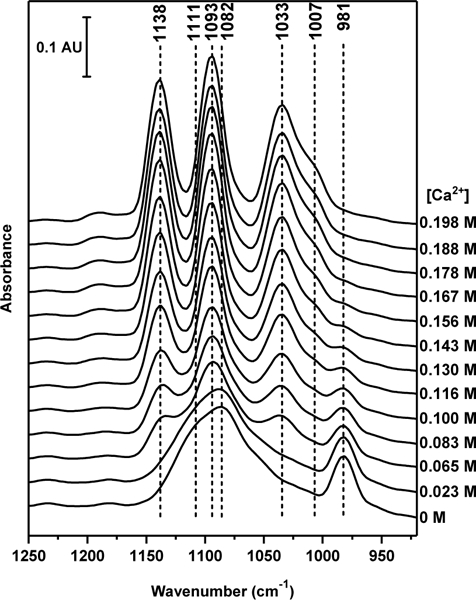
Figure 9.

Infrared spectra of MMP2–. FTIR spectra of monomethyl phosphate were measured in the presence of K+ (2.5 M) with increasing concentrations of Ca2+. The spectrum of monomethyl phosphate at pH 7.5 in the presence of 2.5 M K+ is typical for the completely deprotonated monomehtyl phosphate, i.e., MMP2–.
