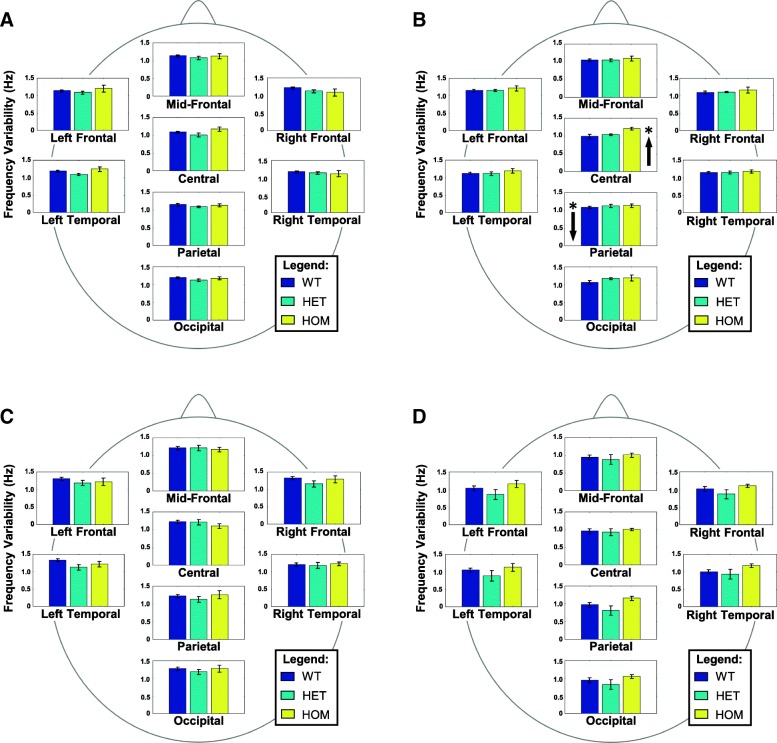
Fig. 2.
Mean (± SEM) dominant frequency variability by scalp region and phenotype. (BLUE = WT, TEAL = HET, YELLOW=HOM). Arrows indicate the direction of significant associations between theta-band power and specific IMPA1 alleles under the recessive FBAT model. Arrows on the left of a graph indicate an association with the wild-type allele within a specific region. Arrows on the right of the graph indicate an association with the mutant allele within a specific region. a No significant associations were observed for theta-band variability in the eyes open condition. b In the eyes closed condition, the mutant allele was associated with a significantly higher central theta variability, and the wild-type allele was associated with significantly lower parietal theta variability. These patterns supplement the power results suggesting a core theta-band oscillatory disturbance resulting from the IMPA1 mutation. c Eyes open and d eyes closed alpha-band variability did not show any regional associations with specific alleles; however, multivariate-FBAT analyses found significant associations between the wild-type allele and alpha variability in the eyes open condition suggesting a more global phenomenon

