
Fig. 3.
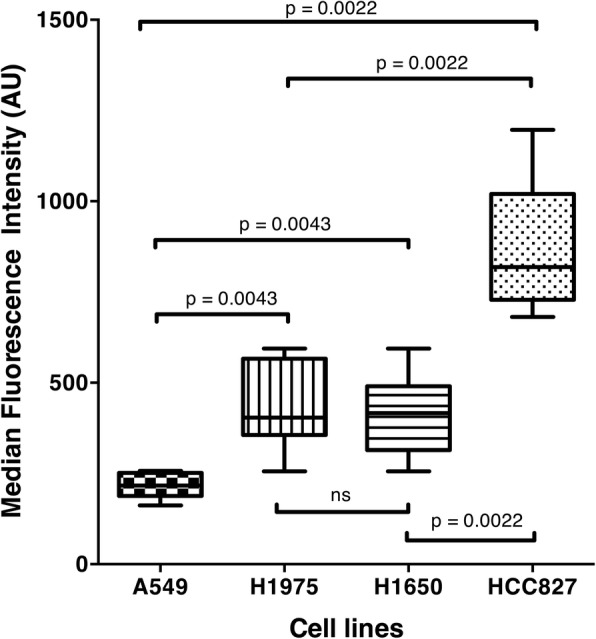
Median Intensity recorded by FCFM imaging following 1-h contact between cell pellet and tracer at a concentration of 1 μmol/l for each cell line: A549, H1975, H1650 and HCC827 (p < 0.001) (ns = not significant)
Official websites use .gov
A
.gov website belongs to an official
government organization in the United States.
Secure .gov websites use HTTPS
A lock (
) or https:// means you've safely
connected to the .gov website. Share sensitive
information only on official, secure websites.
Median Intensity recorded by FCFM imaging following 1-h contact between cell pellet and tracer at a concentration of 1 μmol/l for each cell line: A549, H1975, H1650 and HCC827 (p < 0.001) (ns = not significant)