
Fig. 4.
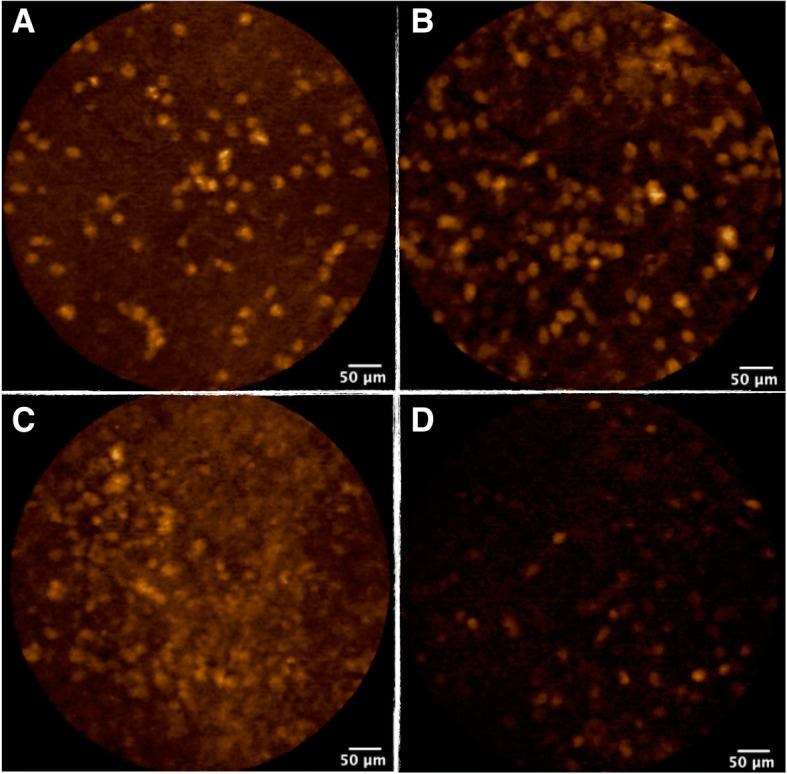
FCFM imaging from ex vivo xenograft following 1-h immersion in tracer at a concentration of 10 μmol/l. Image A: HCC827 line - Image B: H1650 line - Image C: H1975 line - Image D: A549 line
Official websites use .gov
A
.gov website belongs to an official
government organization in the United States.
Secure .gov websites use HTTPS
A lock (
) or https:// means you've safely
connected to the .gov website. Share sensitive
information only on official, secure websites.
FCFM imaging from ex vivo xenograft following 1-h immersion in tracer at a concentration of 10 μmol/l. Image A: HCC827 line - Image B: H1650 line - Image C: H1975 line - Image D: A549 line