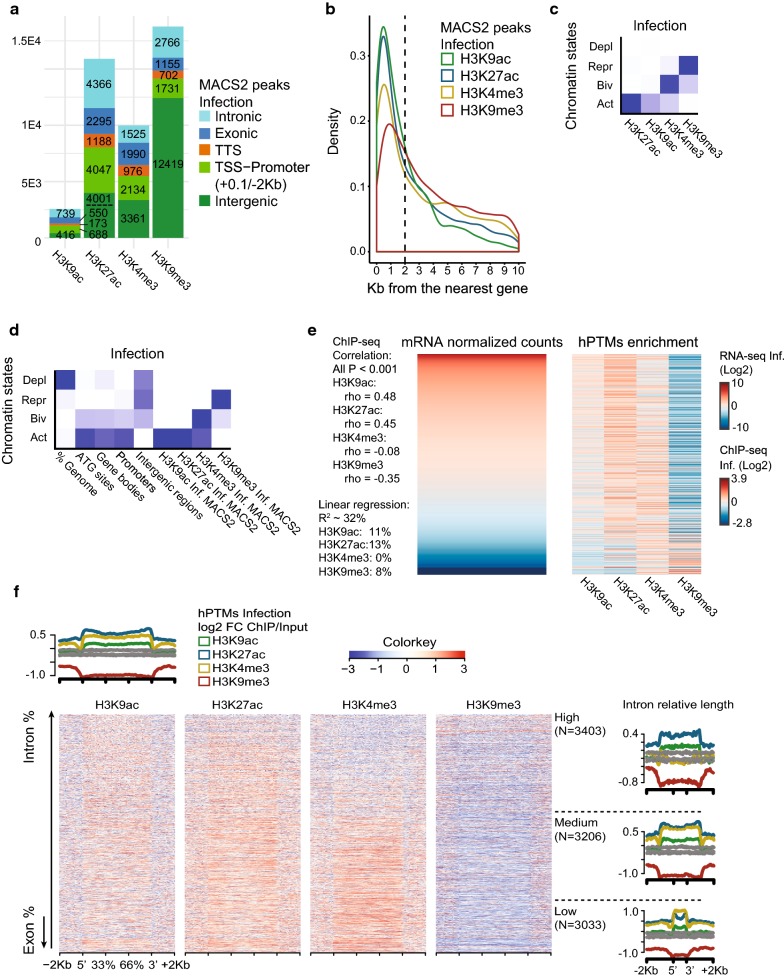
Fig. 1.
Association between histone modification profiles and gene expression regulation in A. gambiae. a Annotation of MACS2 ChIP-seq peaks for each histone modification to genomic features: TSS-Promoters, TTSs, Intergenic, Intron and Exon regions. The plot corresponds to the infected condition; data for the uninfected are given in Additional file 4: Figure S1. b Density plot showing the position (Kb upstream) of MACS2 peaks for each histone modification with respect to the ATG protein initiation codon of the nearest downstream gene. Same as above, data are for the infected condition. c Heatmap of emission parameters from ChromHMM analysis using a four chromatin states model based on histone modification enrichment patterns in the infected condition. The predicted states are: Deplet (depleted, low levels of all hPTMs), Repr (repressive, H3K9me3 enrichment), Biv (bivalent, H3K4me3/H3K9me3 enrichment) and Act (active, H3K27ac/H3K9ac/H3K4me3 enrichment). Darker blue indicates higher enrichment of a particular histone modification. d Heatmap showing the overlap of various genomic features, including MACS2 peaks located in promoters (2 Kb from the ATG) or gene bodies in the infected condition, with the predicted chromatin states. Darker blue in the first column indicates higher percentage of the genome overlapped by a given state. For other columns, it indicates the likelihood of finding a particular chromatin state in each genomic feature compared to what it would be expected by chance. e Heatmaps showing mRNA levels (left) and histone modification enrichment profiles (right) of genes displaying a MACS2 peak in the promoter or the gene body. Data correspond to the infected condition. Genes are ordered by mRNA levels. ChIP-seq enrichment at the promoters and the gene bodies is normalized (RPKM) and input-corrected. Data are log2-scaled and mean-centered. Spearman rank correlation coefficient (rho) and corresponding P value are shown for the association between each histone modification enrichment levels and mRNA levels. The variance in mRNA levels explained by the combined and individual enrichment levels of various histone modifications is shown, according to a linear regression model considering gene expression as response and ChIP-seq enrichment as covariate. f Heatmaps showing histone modification enrichment profiles at high and medium expressed genes in the infected condition. Genes are ordered by the percentage of the body containing introns and exons. Average profile plots show density of normalized (RPKM) and input-corrected ChIP-seq reads for each histone modification at high and medium expressed genes (top) and at those genes classified by the percentage of the gene body containing introns (right)

