
Fig. 2.
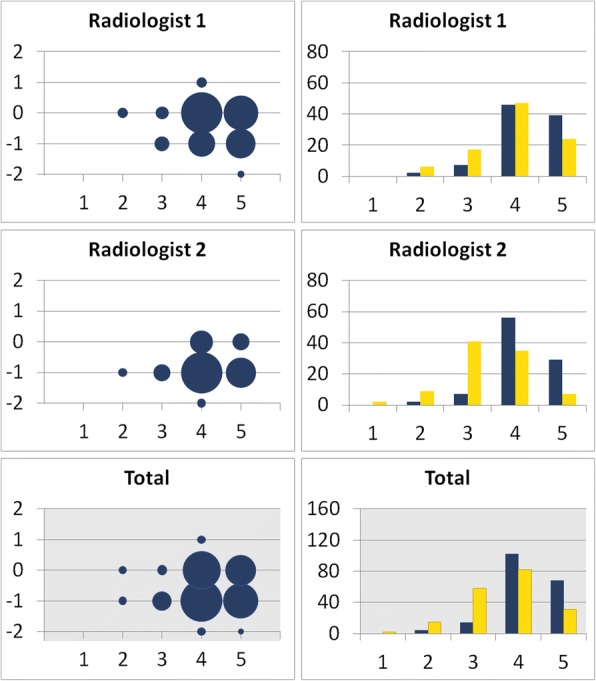
Diagnostic confidence for chest pathologies. Bubble Chart: X-axis: Likert-score (1 = poor catheter tip visualization, 5 = excellent catheter tip visualization) of the unprocessed radiograph. Y-axis: Likert-score improvement of the catheter-enhanced radiograph; e.g. -1 = the catheter-enhanced radiograph score is one point lower than the unprocessed radiograph score. The size of each bubble indicates the number of scores. Bar Graph: Number of scores in each Likert-category; blue = unprocessed radiographs, yellow = catheter-enhanced radiographs. Radiologist 1 reports a better diagnostic confidence for chest pathologies in two catheter-enhanced radiographs. In all other cases the unprocessed radiographs were rated equal or superior to the catheter-enhanced radiographs