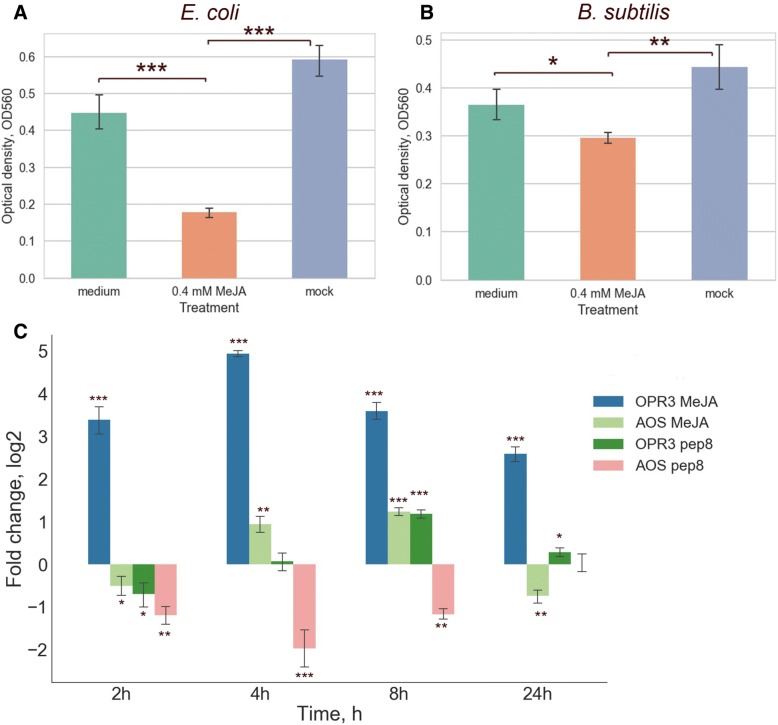
Fig. 4.
Analysis of biological activity of the secreted peptides. a The barplot shows optical density of E. coli cultures after 24-h incubation with the 400 μM MeJA-treated, mock secretome samples and culture medium with 400 μM MeJA. b The barplot shows optical density of B. subtilis cultures after 24-h incubation with 400 μM MeJA-treated, mock moss secretome samples and culture medium with 400 μM MeJA. The bars (M ± SD) represent the results of three independent experiments performed in triplicate. c qRT-PCR analyses of OPR3 and AOS genes expression in protonema tissue treated with 1μM pep8 and 0.4 mM MeJA. P value were calculated by an unpaired t-test. *P<0.05; **P<0.005; ***P<0.0005

