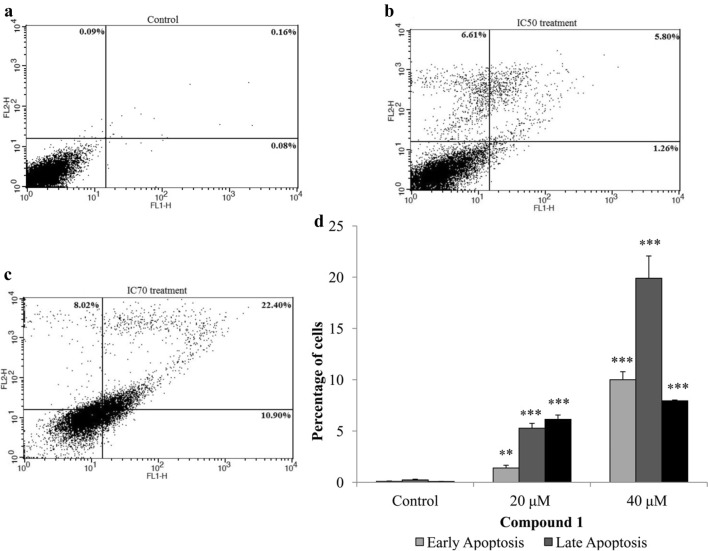
Fig. 4.
Compound 1 induced apoptosis in CAL-27 cell line in a dose-dependent manner. a–c Flow cytometric analysis of the apoptosis induced by the compound 1 at IC50 and IC70 concentrations. An increased number of apoptotic cells were observed after treatment as compared to control. d Graphical representation of the cells in different phases of apoptosis after 48 h of treatment. Statistical significance were expressed as **p < 0.01 and ***p < 0.001 as compared to the untreated control

