
Figure 2. Dependence of the formation of FtsZ·SlmA·SBS condensates on protein and salt concentrations.
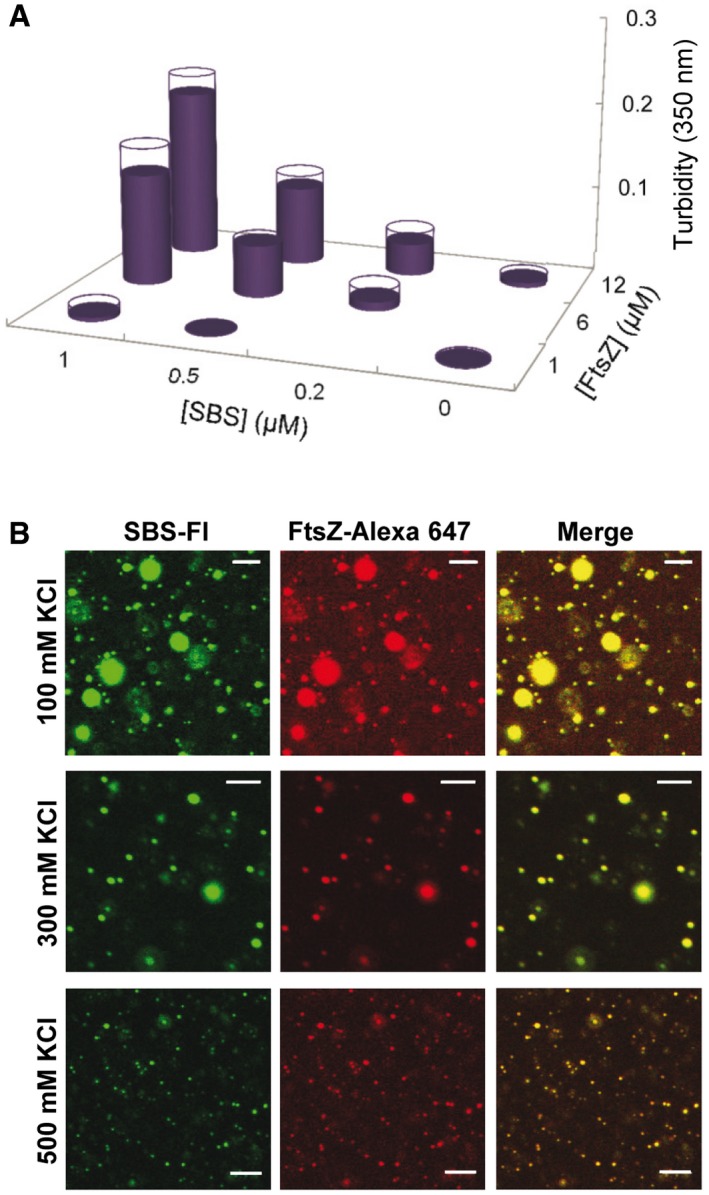
- Formation of condensates as a function of FtsZ and SlmA·SBS concentration, as measured by turbidity, in working buffer (300 mM KCl). SlmA concentration was fivefold that of SBS (except at 0.5 μM SBS, where SlmA concentration was 3 μM). Data are the average of two independent measurements. Errors (SD), symmetrical, are depicted as white disks.
- Representative confocal images of the FtsZ·SlmA·SBS condensates at the specified salt concentrations. The concentrations of FtsZ, SlmA, and SBS were 12, 5, and 1 μM, respectively. Scale bars: 5 μm.