
Figure EV3. FtsZ·SlmA·SBS condensates in the PEG/DNA LLPS system.
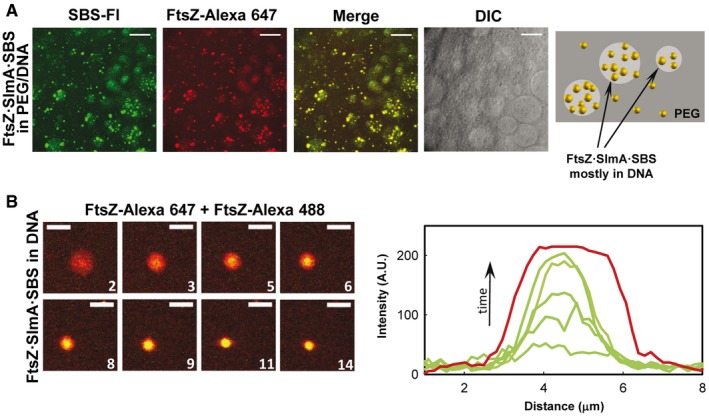
- Representative confocal images of FtsZ·SlmA·SBS complexes and schematic illustration of their disposition within the phases on the right.
- Stepwise diffusion of FtsZ‐Alexa 488 added on FtsZ·SlmA·SBS condensates (FtsZ labeled with Alexa 647) at the indicated times in seconds (time zero, beginning of visualization for this particular condensate) in 180 g/l DNA. On the right, representative intensity profiles in the green channel at different times. The profile in the red channel, shown as a reference, varies slightly within the images.