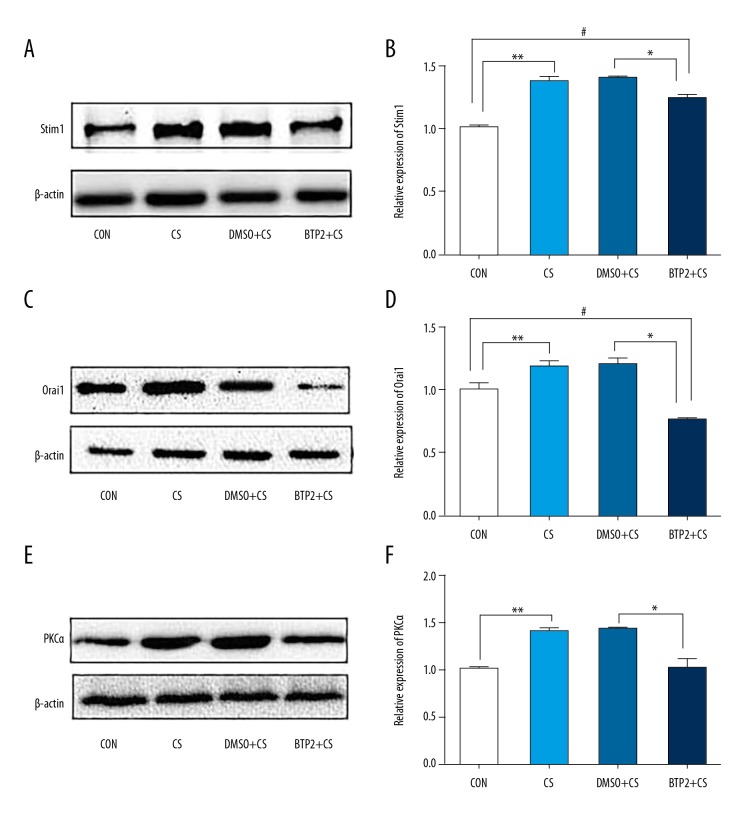
Figure 2.
Analysis of Stim1, Orai1, and PKCα protein expression in ECs. ECs pre-treated with DMSO or BTP2 for 2 h were exposed to 18% cyclic stretching. (A) Representative blot is shown from 3 independent experiments. The protein bands were quantified by densitometry relative to β-actin. (A, B) Show Stim1 protein levels in ECs. (C, D) Show Orai1 protein levels. (E, F) Show PKCα protein levels. ** and #, P<0.05, compared with control group. * P<0.05 compared with DMSO+CS group. Data are mean ±SD.

