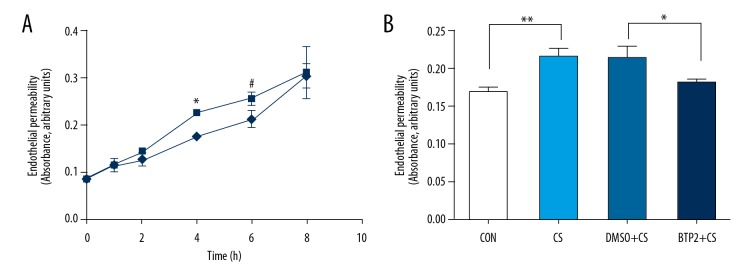
Figure 3.
Endothelial permeability determined by the influx of Evans blue-labeled albumin. (A) Shows endothelial permeability represented by the absorbance value changed as ECs were exposed to 18% CS (CS group) or not (control group) for indicated time. * and #, P<0.05 compared with control group. (B) Indicates that ECs pre-treated with DMSO or BTP2 were exposed to 18% CS. After 4 h, endothelial permeability was measured. ** P<0.05, compared with control group; * P<0.05, compared with DMSO+18% CS group.

