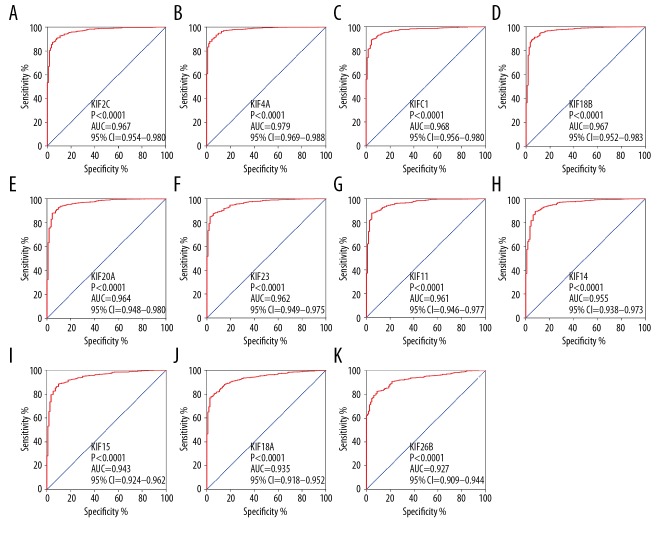
Figure 4.
ROC curves (AUC>0.9) of KIF gens for distinguishing BC tumor tissue and adjacent normal tissues in TCGA. ROC curves of KIF2C (A), KIF4A (B), KIFC1 (C), KIF18B (D), KIF20A (E), KIF23 (F), KIF11 (G), KIF14 (H), KIF15 (I), KIF18A (J), and KIF26B (K). KIF – kinesin; TCGA – the Cancer Genome Atlas; BC – breast cancer; AUC – area under the curve; ROC – receiver operating characteristic.

