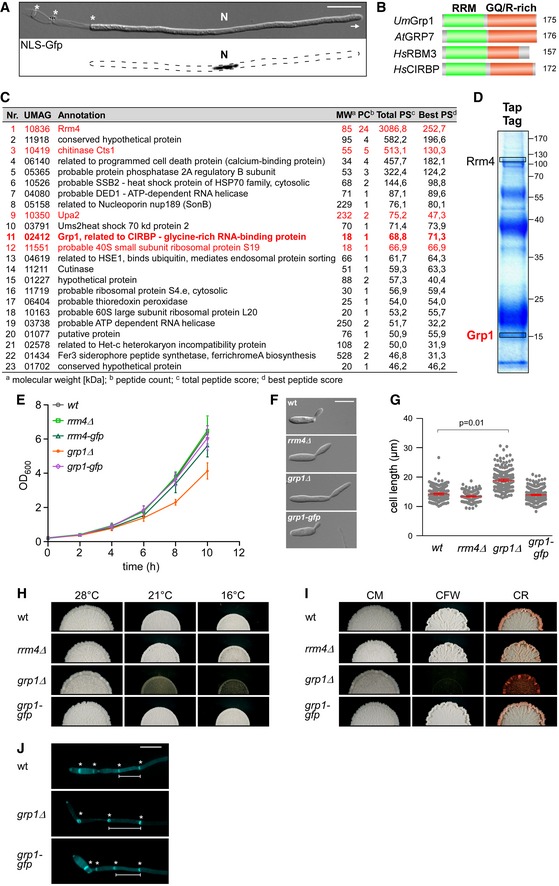
Hyphal form (6 hours post‐induction, h.p.i.) of laboratory strain AB33 expressing a Gfp‐tagged protein with nuclear localisation signal to stain the nucleus (N; λN‐NLS‐Gfp, phage protein λN fused to triple Gfp, containing a nuclear localisation signal; inverted fluorescence image shown; scale bar, 10 μm). Hyphae expand at the apical pole (arrow) and insert septa (asterisks) at the basal pole in regular time intervals resulting in the formation of empty sections.
Schematic representation of the domain architecture of four small glycine‐rich proteins (RRM, RNA recognition motif, green; GQ/R, glycine‐rich region with arginine or glutamine, red).
UmGrp1 from
U. maydis (UMAG_02412),
AtGRP7 from
Arabidopsis thaliana (RBG7;
NC_003071.7),
HsRBM3 and
HsCIRBP from
Homo sapiens (
NC_000023.11 and
NC_000019.10, respectively). Number of amino acids indicated on the right.
Results of preliminary affinity purification experiments using Rrm4‐GfpTT as bait (see
Materials and Methods). Proteins with a functional link to Rrm4 are marked in red (this study)
18,
64. Peptide count: number of identified peptides corresponding to predicted protein; total peptide score: sum of all peptide scores corresponding to predicted protein, excluding the scores of duplicate matches; best peptide score: best score from all identified peptides corresponding to predicted protein. Note that the difference between total peptide score and best peptide score is a correction of the software depending on how many possible predicted candidates match to the identified peptide mass.
Tandem affinity purification using Rrm4‐GfpTT as bait. Protein bands were stained with Coomassie blue after SDS–PAGE. Proteins in boxed areas were identified as Rrm4 and Grp1 (size of marker proteins in kDa on the right).
Growth curve of indicated AB33 derivatives growing in liquid culture. Data points represent averages from three independent experiments (n = 3). Error bars show s.d.
Differential interference contrast (DIC) images of AB33 derivatives as yeast‐like budding cells (scale bar, 10 μm).
Length of budding cells (shown are merged data from three independent experiments, n = 3; > 100 cells per strain were analysed, wt, 269; rrm4Δ, 122 (only two independent experiments); grp1Δ, 263; grp1G, 318), overlaid with the mean of means, red line and s.e.m.; paired two‐tailed Student's t‐test on the mean cell lengths from the replicate experiments.
Colonies of indicated AB33 strains grown in the yeast form incubated at different temperatures (28°C for 1 day or 16°C and 21°C for 5 days).
Colonies of indicated AB33 strains grown in the yeast form. Incubated plates contained cell wall inhibitors (CM, complete medium for 1 day; CFW, 50 μM calcofluor‐white for 4 days; CR, 57.4 μM Congo red for 4 days).
Fluorescence images of the basal pole of hyphae of AB33 derivatives (6 h.p.i.). Septa (asterisks) were stained with CFW. White bars indicate exemplary length measurements of empty sections shown in Fig
1D (scale bar, 10 μm).

