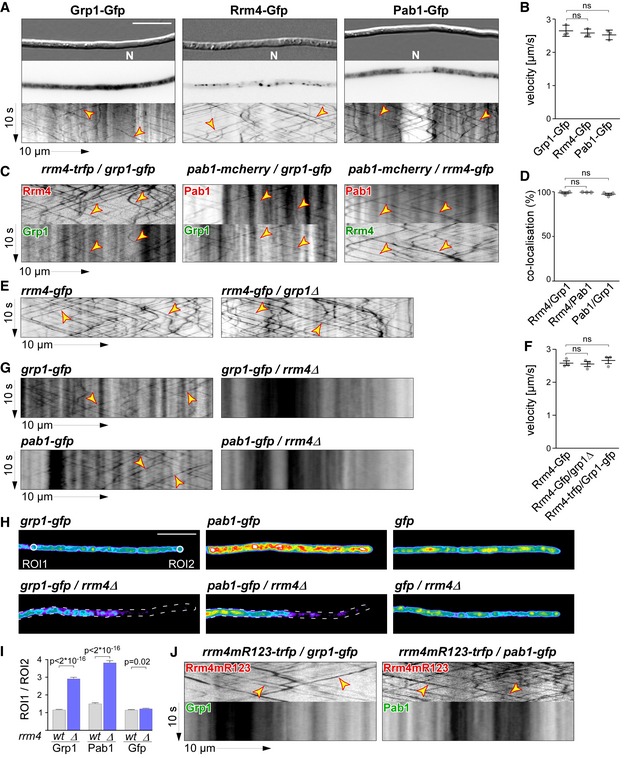
Figure 2. Grp1 shuttles on Rrm4‐positive endosomes throughout hyphae.

- Micrographs (DIC and inverted fluorescence image; scale bar, 10 μm) and corresponding kymographs of AB33 hyphae (6 h.p.i.) expressing Grp1‐Gfp, Rrm4‐Gfp or Pab1‐Gfp (arrow length on the left and bottom indicates time and distance, 10 s and 10 μm, respectively). To visualise directed movement of signals (distance over time) within a series of images, kymographs were generated by plotting the position of signals along a defined path (x‐axis) for each frame of the corresponding video (y‐axis). Bidirectional movement is visible as diagonal lines (yellow arrowheads; N, nucleus; Video EV1). For an example image of a complete AB33 hypha, see Fig EV1A.
- Average velocity of fluorescent signals per hypha for strains shown in (A) (movement of tracks with > 5 μm was scored as processive). Data points represent averages from three independent experiments (n = 3), with mean, red line and s.e.m. At least 20 signals/hyphae were analysed out of 12 hyphae per experiment (ns; P = 0.18 and P = 0.23) using a paired two‐tailed Student's t‐test on the means.
- Kymographs of hyphae of AB33 derivatives (6 h.p.i.) expressing pairs of red and green fluorescent proteins as indicated. Fluorescence signals were detected simultaneously using dual‐view technology (arrow length as in A). Processive co‐localising signals are marked by yellow arrowheads (Videos EV2, EV3 and EV4).
- Percentage of red fluorescent signals exhibiting co‐localisation with the green fluorescent signal for strains shown in (C). Data points represent observed co‐localisation in three independent experiments, mean, dark grey line and s.e.m. (n = 3, 11 hyphae each; paired two‐tailed Student's t‐test on the means; ns; P = 0.63 and P = 0.5).
- Kymographs comparing hyphae of AB33 derivatives (6 h.p.i.) expressing Rrm4‐Gfp in the wild type (left) or grp1Δ strains (right) (processive signals marked by yellow arrowheads; arrow length on the left and bottom indicates time and distance, 10 s and 10 μm, respectively; Video EV5).
- Average velocity of fluorescent signals per hyphae for strains shown in (E) (movement of tracks with > 5 μm were scored as processive). Data points represent averages from three independent experiments (n = 3) with mean, black line and s.e.m. At least 20 signals/hypha were analysed out of at least 10 hyphae per experiment (ns; P = 0.27 and P = 0.4) using a paired two‐tailed Student's t‐test on the means.
- Kymographs comparing hyphae (6 h.p.i.) expressing Grp1‐Gfp or Pab1‐Gfp in wild type (left) with rrm4Δ strains (right; processive signals marked by yellow arrowheads; arrow length as in A).
- Hyphal tips (4 h.p.i.) of AB33 derivatives expressing Grp1‐Gfp, Pab1‐Gfp or Gfp alone comparing wild type (top) with rrm4Δ strains (bottom). Fluorescence micrographs in false colours (black/blue to red/white, low to high intensities, respectively; scale bar, 10 μm; ROI1 and ROI2‐labelled circles exemplarily indicate regions of interest analysed in E).
- Ratio of signal intensities in strains shown in (H) comparing Gfp fluorescence at the tip (ROI1) and in close vicinity to the nucleus (ROI2; see Materials and Methods). Bars represent mean and s.e.m. (wt: n = 160; rrm4Δ: n = 152), Pab1G (n = 126; rrm4Δ: n = 170), Gfp (n = 152; rrm4Δ: n = 210), unpaired two‐tailed Student's t‐test.
- Kymographs of hyphae of AB33 derivatives (6 h.p.i.) expressing pairs of red and green fluorescent proteins as indicated (arrow length as in A; Videos EV6 and EV7). Fluorescence signals were detected simultaneously using dual‐view technology. Processive co‐localising signals are marked by yellow arrowheads. Note that processive movement is completely lost in the lower panels. Only static signals, visualised as vertical lines, are remaining.
