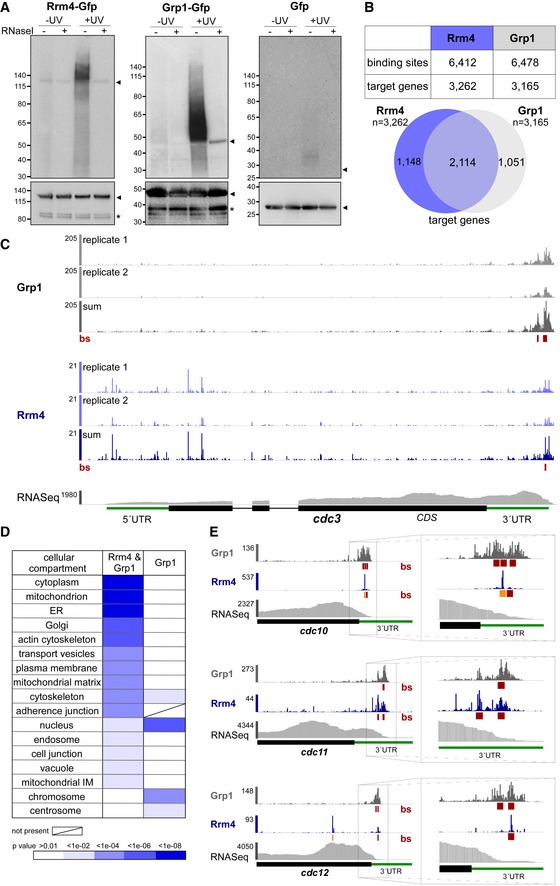
Figure 3. Rrm4 and Grp1 bind to thousands of target transcripts.

- Autoradiograph and Western blot analyses for representative iCLIP experiments with Rrm4‐Gfp, Grp1‐Gfp and Gfp. Upper part: Upon radioactive labelling of co‐purified RNAs, the protein‐RNA complexes were size‐separated in a denaturing polyacrylamide gel. Protein‐RNA complexes are visible as smear above the size of the protein (Rrm4‐Gfp, 112 kDa; Grp1‐Gfp, 45 kDa; Gfp, 27 kDa; indicated by arrowheads on the right). Samples with and without UV‐C irradiation and RNase I (see Materials and Methods) are shown. Lower part: corresponding Western blot analysis using α‐Gfp antibody (arrowheads and asterisks indicate expected protein sizes and putative degradation products, respectively).
- Summary of binding sites and target transcripts of Rrm4 and Grp1 (top). Venn diagram (below) illustrates the overlap of Rrm4 and Grp1 target transcripts.
- iCLIP data for Rrm4 and Grp1 on cdc3 (UMAG_10503; crosslink events per nucleotide from two experimental replicates [light grey/light blue] and merged data [grey/blue] from AB33 filaments, 6 h.p.i.). Track below the merged iCLIP data shows binding sites for each protein (bs, red). Note that crosslink events in the 5′ UTR and first exon of cdc3 were not assigned as binding sites due to low reproducibility between replicates (see Materials and Methods). RNASeq coverage from wild type AB33 filaments (6 h.p.i.) is shown for comparison. Gene model with exon/intron structure below was extended by 300 nt on either side to account for 5′ and 3′ UTRs (green).
- Functional categories of cellular components (FunCat annotation scheme, 78) for proteins encoded by target transcripts that are shared between Rrm4 and Grp1 (left) or unique to Grp1 (right). P‐values for the enrichment of the listed category terms are depicted by colour (see scale below).
- iCLIP data (crosslink events from merged replicates) for Rrm4 (blue) and Grp1 (grey) as well as RNASeq coverage on selected target transcripts (cdc10, UMAG_10644; cdc11, UMAG_03449; cdc12, UMAG_03599). Enlarged regions (indicated by boxes) of the 3′ UTR (green) are shown on the right. Datasets and visualisation as in (C). Binding sites (bs) are shown (red; orange indicates overlap with UAUG).
