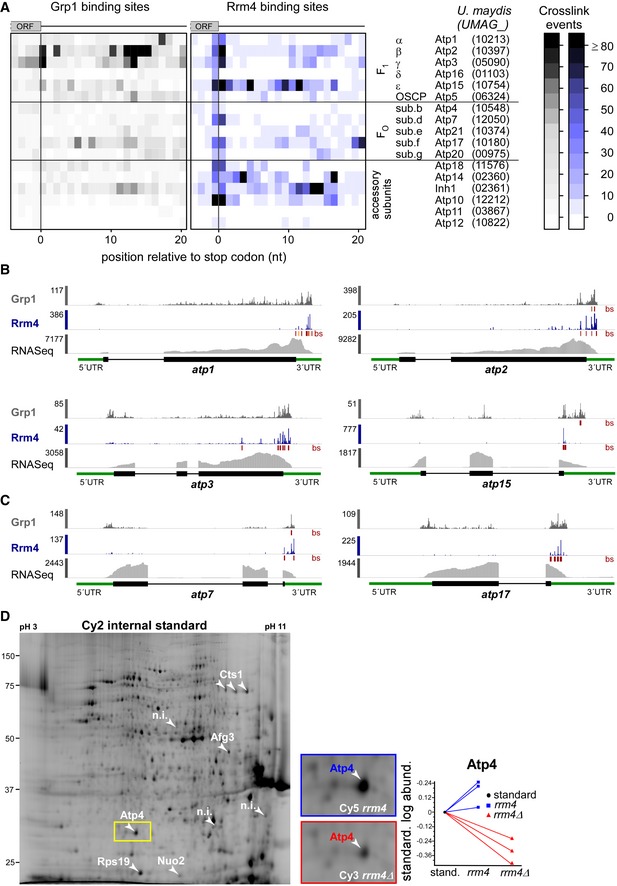
Figure EV4. Accumulation of crosslink events at stop codons of mRNAs encoding subunits of the mitochondrial F1FO‐ATPase.

-
AHeatmap of crosslink events of Grp1 (left) and Rrm4 (right) in a window around the stop codons (position 0 = first position of 3′ UTR) of mRNAs encoding subunits of the mitochondrial F1FO‐ATPase (nomenclature and gene identifiers for U. maydis on the right). Crosslink events per nucleotide are represented by a colour scale (right).
-
B, CiCLIP data of Rrm4 and Grp1 as well as RNASeq data across selected mRNAs of the F1 subcomplex (B) and FO subcomplex (C) that carry an Rrm4 binding site precisely at the stop codon. Visualisation as in Fig 3C.
-
DCy2 image of a representative differential gel electrophoresis (DIGE) analysis comparing membrane‐associated proteins of wild type (blue, Cy5‐labelled) and rrm4Δ hyphae (red, Cy3‐labelled; size marker on the left, pH range at the top; 6 h.p.i.). Protein variants exhibiting at least 2.5‐fold differences in protein amounts are indicated by numbered arrowheads (taken from earlier study) 18. The area marked with a yellow rectangle is enlarged on the right. The corresponding standardised logarithmic protein abundances for the Atp4 spot obtained from three biological replicates are given on the right (internal standard set to 0).
