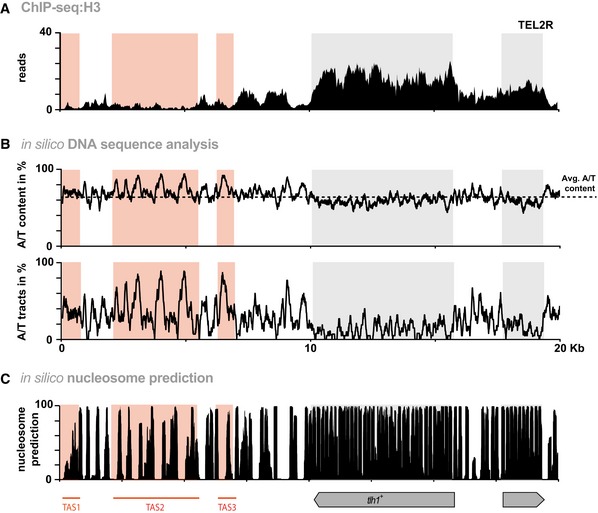
Figure 4. Nucleosome abundance is low throughout the telomere‐proximal chromosomal region.

- ChIP‐seq reads mapped to TEL2R (shown in reverse orientation for consistency).
- In silico analyses of TEL2R DNA sequence. Black line in top panel shows A/T content. Dotted line represents average A/T content in S. pombe (www.pombase.org). Bottom panel shows the percentage of poly[dA:dT] tracts (defined as a sequence of 5 or more nucleotides consisting only of A or T). Red and gray shaded areas show TAS regions and subtelomeric genes, respectively.
- Nucleosome prediction for TEL2R using prediction algorithm 33.
