-
A–D
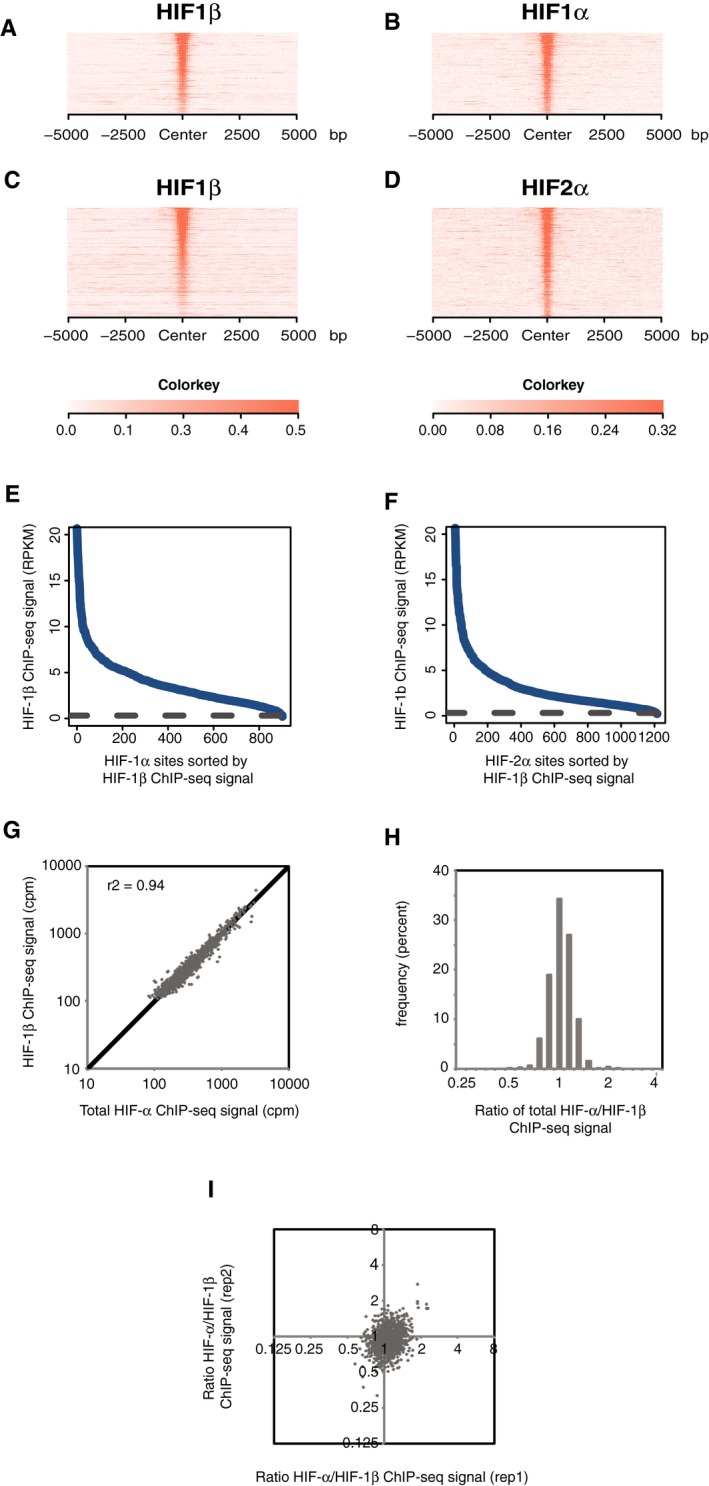
Sites that bound either HIF‐1α (A and B) or HIF‐2α (C and D) in normoxic RCC4 cells in both replicates were identified by the MACS peak caller and ordered on the y‐axis according to HIF‐1β signal intensity. Heatmaps show HIF ChIP‐seq signal (read counts per million mapped reads, CPM; expressed as colour intensity, averaged across two independent ChIP‐seq experiments) at HIF binding sites and across the flanking ±5 kb regions (x‐axis). (A) HIF‐1β signal intensity and (B) HIF‐1α signal intensity at HIF‐1α binding sites and (C) HIF‐1β signal intensity and (D) HIF‐2α signal intensity at HIF‐2α binding sites. HIF‐1β signal intensity above local background levels is observed at all HIF‐1α and HIF‐2α binding sites.
-
E, F
Line plots showing average (n = 2, independent ChIP‐seq experiments) HIF‐1β signal intensity (solid blue lines) at MACS defined (E) HIF‐1α and (F) HIF‐2α binding sites compared to the average background HIF‐1β binding signal at non‐HIF‐α binding accessible sites (defined by FAIRE‐seq). Sites are ranked on the x‐axis according to HIF‐1β signal. HIF‐1β signal intensity at both HIF‐1α and HIF‐2α binding sites was consistently above genome‐wide background levels.
-
G
Total HIF‐α (HIF‐1α + HIF‐2α) signal intensity was plotted against HIF‐1β signal intensity for all sites that bound one or more HIF subunits. Strong correlation was observed between HIF‐α and HIF‐1β signal intensities.
-
H
The ratio of total HIF‐α signal to HIF‐1β signal (x‐axis) was determined for each site and plotted as a frequency distribution (y‐axis) showing a tight unimodal distribution.
-
I
The reproducibility of total HIF‐α/HIF‐1β ratio was assessed by plotting the ratio in replicate 1 versus that in replicate 2.