
Figure 4. The effect of duration of hypoxia on HIF binding.
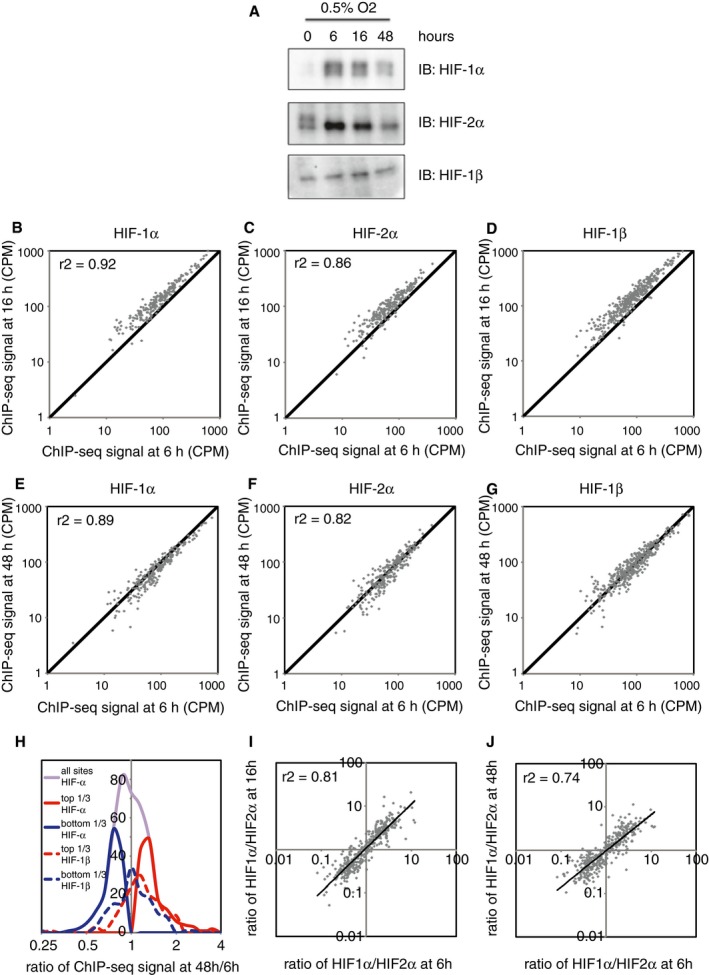
HKC‐8 cells were incubated in 0.5% ambient oxygen for 6, 16 or 48 h.
-
AImmunoblots show induction of HIF‐1α and HIF‐2α protein level, which is highest at 6 h and falls by 48 h.
-
B–D(B) HIF‐1α, (C) HIF‐2α and (D) HIF‐1β ChIP‐seq signal intensities (averaged across two independent ChIP‐seq experiments) at 16 h are plotted against those at 6 h for all canonical HIF binding sites that bound at any of the three time points. ChIP‐seq signal was increased at 16 h of hypoxia compared to 6 h of hypoxia, but correlated well between the two time points, and no novel sites were observed at either time point.
-
E–GThe same plots comparing (E) HIF‐1α, (F) HIF‐2α and (G) HIF‐1β ChIP‐seq signals at 48 and 6 h of hypoxia. ChIP‐seq signal at 48 h correlated well with that at 6 h, and again, no novel sites were observed at either time point.
-
HFrequency distribution of ChIP‐seq signals at 48 h compared to 6 h of hypoxia. The ratio of total HIF‐α signal had a unimodal distribution (purple line). However, upper tertile HIF‐α sites (solid red line) had a comparable ratio of HIF‐1β signal (dotted red line) to the ratio of HIF‐1β signal in the lower tertile HIF‐α sites (blue lines), suggesting that differences in HIF‐α signal resulted from random variation rather than a true biological difference.
-
I, JThe ratio of HIF‐1α to HIF‐2α ChIP‐seq signal for all canonical HIF binding sites at (I) 16 h of hypoxia and at (J) 48 h of hypoxia was plotted against that at 6 h of hypoxia. A strong correlation in the HIF‐1α‐to‐HIF‐2α ratio was observed between the various time points.