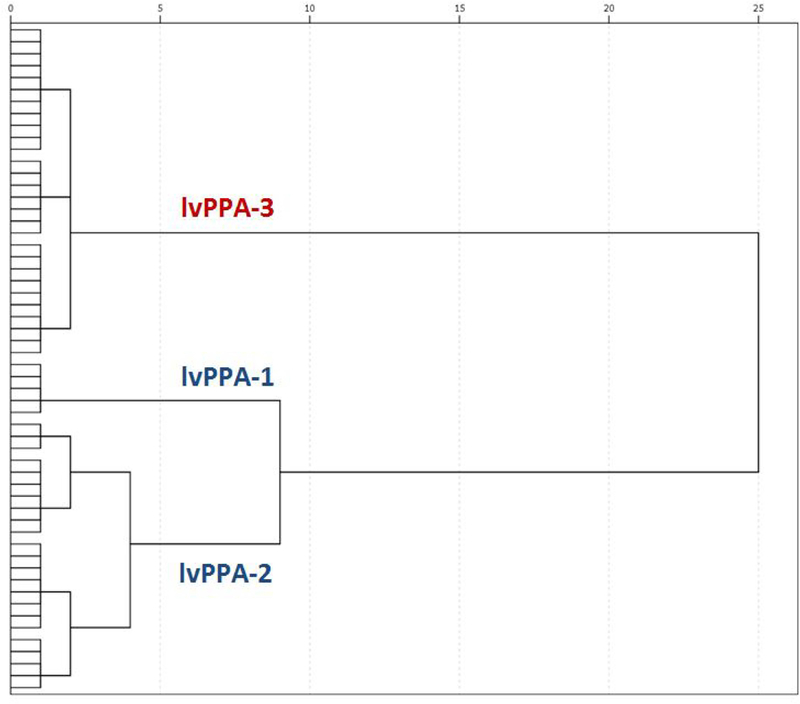
Figure 1:

Dendrogram created by cluster analysis. The distance along the x-axis represents a measure of similarity’ between subjects, such that the closer the distance the greater the similarly between them. Cluster 1 (lvPPA-1) consisted of subjects with no neurocogmtive deficits on neuropsychological tests. Cluster 2 (lvPPA-2) showed mild neurocogmtive deficits on neuropsychological tests. Based on the dendrogram, these groups together represent milder lvPPA (i.e., lvPPA-mild). Cluster 3 (lvPPA-3) showed marked neurocogmtive deficits (i.e.. lvPP A-marked).
