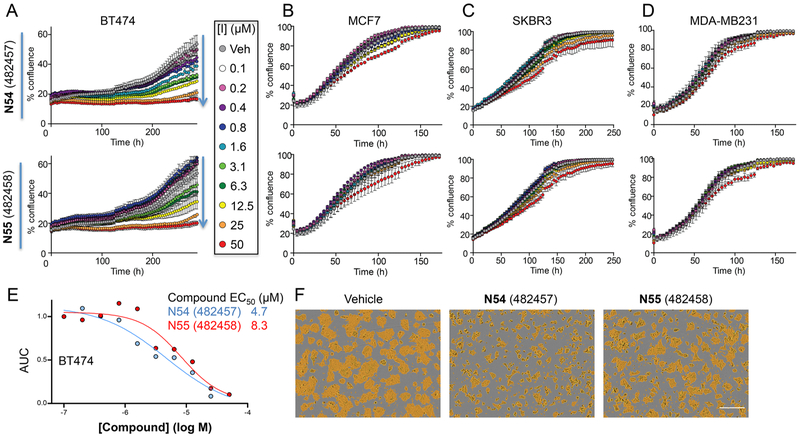
Figure 7.
Proliferation of (R)-N54 and (S)-N55 treated breast cancer lines. N54 and N55 inhibit proliferation of (A) BT474 but not (B) MCF7, (C) SKBR3, or (D) MDA- MB231. Growth curves represent percent confluence (mean ± SD, n = 3). (E) N54 is a more potent inhibitor of BT474 proliferation than N55. AUC for growth (% confluence over 288 h) is plotted versus inhibitor concentration. (F) Micrographs at 240 h posttreatment, with the confluence mask shown in yellow. Scale bar is 300 μm.

