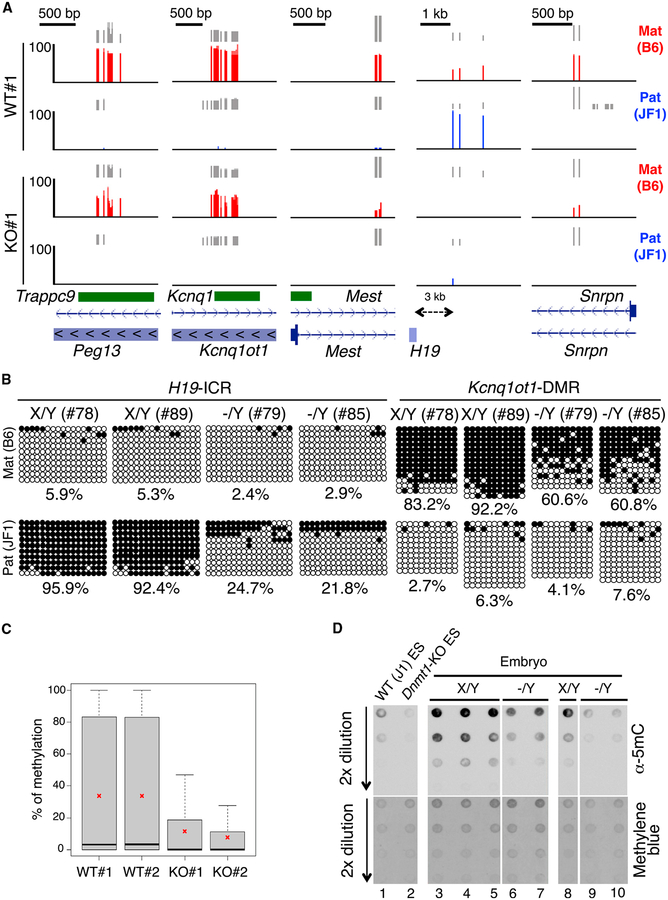
Figure 3. Decreased Allele-Specific Methylation in ICRs/DMRs of Naa10p-Null Mouse Embryos and ESCs.
(A) Naa10p KO dysregulates allele-specific methylation of ICRs/DMRs in ESCs. Allele-specific RRBS results of five ICRs/DMRs of WT#1 and KO#1 B6/JF1 hybrid ES clones are shown. RRBS reads were mapped to B6 and JF1 genomes using the ASAP, and only the reads specific to either genome were retained as maternal B6 (red) or paternal JF1 (blue) reads. Vertical gray lines represent the sequence read depth for each cytosine scored, and reads >10 are shown. The vertical red (B6) and blue (JF1) lines represent the percent methylation for each cytosine scored, which ranges from 0%–100%. For each gene, reference sequence (RefSeq) exon organization (blue) and location of CpG islands (green) are shown at the bottom.
(B) Naa10p KO causes hypomethylation of the imprinted allele in embryos. Allele-specific bisulfite sequencing was performed for H19-ICR and Kcnq1ot1-DMR in the same hybrid B6/JF1 embryos as in Figure 2. Open and closed circles indicate non-methylated and methylated, respectively, cytosines of CpGs examined. The numbers at the bottom of each panel represent the percentage of CpG methylation.
(C) RRBS analyses reveal global loss of DNA methylation in Naa10-null ESCs. Shown are the percentages of DNA methylation of two WT and two Naa10-KO ESCs used in (A). Asterisks indicate the mean of the DNA methylation.
(D) Naa10-KO embryos show DNA hypomethylation. Dot blot analyses are shown for the 5mC level using genomic DNAs from WT ESCs (lane 1), Dnmt1-KO ESCs (lane 2), embryos of Naa10X/Y (lanes 3–5 and lane 8), and Naa10−/Y mice (lanes 6 and 7 and lanes 9 and 10). Methylene blue staining shows equal loading in lanes 3–7 and lanes 8–10.
See also Figure S3.

