
Figure 2 |. Hub diversity and locality, modularity, and network connectivity predict cognitive performance.
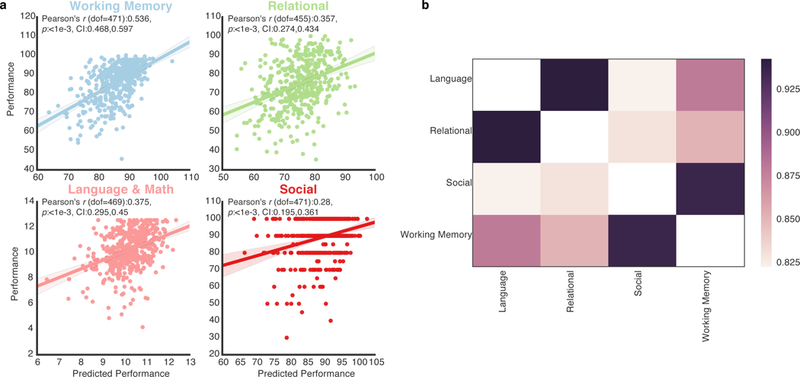
a, for each task, the correlation between task performance and the performance predicted by a predictive model of hub diversity and locality, modularity, and network connectivity. Each data point represents the (y-axis) true performance (see Methods, each task’s performance value scale is unique) of the subject and the (x-axis) predicted performance of the subject by the neural network. Shaded areas represent 95 percent confidence intervals. In every task, the predictive model significantly predicted task performance (p < 1e-3, Bonferroni corrected (n tests=4), N=Working Memory: 473, Relational: 457, Language & Math: 471, Social: 473). b, we correlated the tasks’ feature correspondence values (see Supplementary Figure 3 for each task’s feature correspondence with each subject measure)—measuring if the two tasks’ optimal hub and network structures are also optimal for the same subject measures. High correlations mean that the two tasks’ hub and network structures are similarly optimal for the same subject measures (all results significant at p < 1e-3, Bonferroni corrected (n tests = 4), dof=45, N=47, the number of subject measures, while the feature correspondence N =Working Memory: 473, Relational: 457, Language & Math: 471, Social: 473).