Fig. 2.

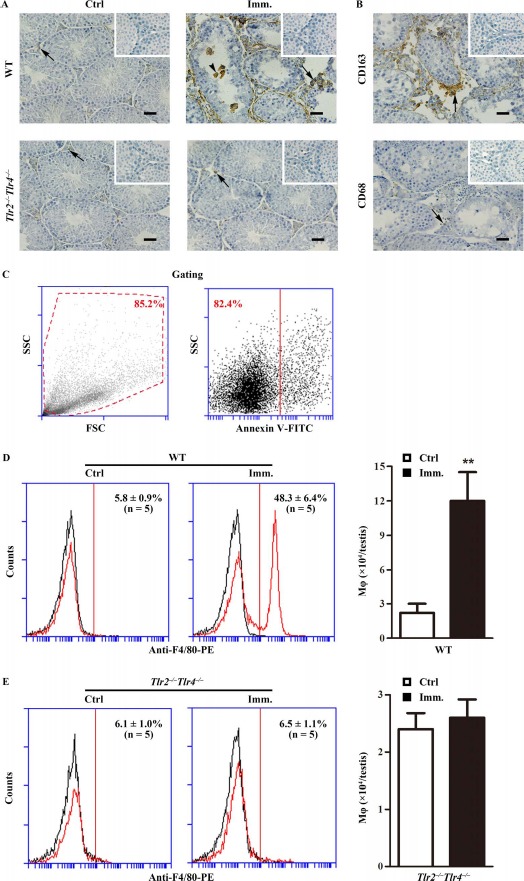
Macrophage accumulation. A) Immunohistochemistry for macrophages. Testicular cryosections of WT and Tlr2−/−Tlr4−/− mice at 50 days after the first immunization (Imm.) were immunostained with anti-F4/80 antibody (right panels). Testes of mice injected with CFA alone served as control (Ctrl, left panels). B) Detection of CD163+ and CD68+ cells. Immunohistochemical analyses of testicular sections of immunized WT mice were performed using specific antibodies against CD163 and CD68. Insets in the upper right corner are the negative controls in which preimmune sera were used as primary antibodies. Arrows and arrowheads indicate macrophages in the interstitial spaces and seminiferous tubules. Bar = 20 μm. The images are the representatives of at least three mice. Immunohistochemistry was performed on one testis in each mouse. C–E) Quantitative analysis of macrophages. Testicular interstitial cells were labeled with FITC-conjugated annexin V (annexin V-FITC, a marker of apoptotic cells) and PE-conjugated anti-F4/80 antibody (anti-F4/80-PE). Cell debris (C, left panel) and apoptotic cells (C, right panel) were gated out. Flow cytometry density plots are the representatives of the interstitial cells from immunized WT mice. Macrophages in the testes of WT (D) and Tlr2−/−Tlr4−/− (E) mice were quantitatively analyzed using flow cytometry. Left panels represent flow cytometry density plots, and right panels represent absolute macrophage numbers per testis based on flow cytometry data. Data are mean values ± SEM of five mice. Two testes per mouse were used in each flow cytometry analysis. **P < 0.01.
