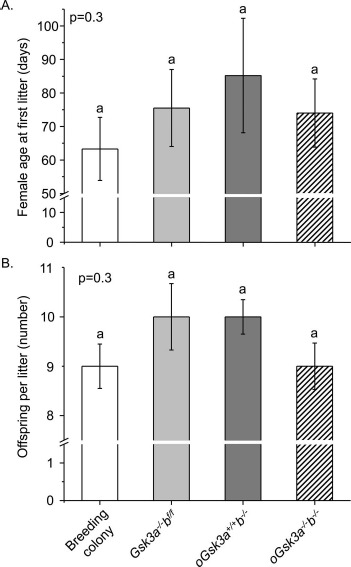
Fig. 3.

Characterization of Gsk3a−/−bf/f, oGsk3a+/+b−/−, and oGsk3a−/−b−/− females fertility in comparison to fertility of breeding colony females. A) Age at first conception of Gsk3a−/−bf/f (n = 4), oGsk3a+/+b−/− (n = 5), and oGsk3a−/−b−/− (n = 6) females were similar between transgenic groups and females in the mouse breeding colony (n = 15). Values represent mean ± SEM. B) The number of offspring per litter of transgenic females (Gsk3a−/−bf/f (n = 9), oGsk3a+/+b−/− (n = 10), and oGsk3a−/−b−/− (n = 13)) bred to FVB/NJ males were similar between transgenic groups and females in the mouse breeding colony (n = 29). Values represent mean ± SEM.
