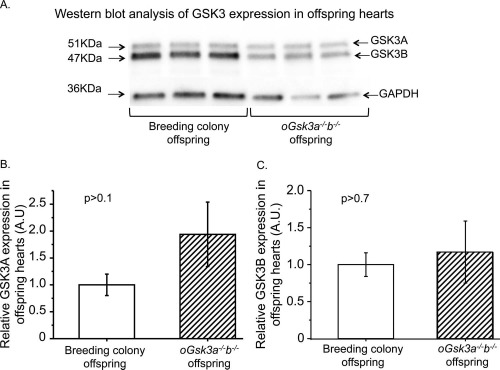
Fig. 7.

Comparison of GSK3 isoforms protean expression in hearts from breeding colony and oGsk3a−/−b−/− female-derived offspring. A) Representative micrographs of GSK3A, GSK3B, and GAPDH protein detection in hearts from breeding colony and oGsk3a−/−b−/− female-derived offspring. B) Levels of GSK3A in breeding colony offspring hearts (n = 11) were comparable to those observed in hearts from oGsk3a−/−b−/− female-derived offspring (n = 7). C) Heart GSK3B levels in breeding colony offspring (n = 11) were similar to those observed in hearts from oGsk3a−/−b−/− female-derived offspring (n = 7). Values in column graphs are means ± SEM.
