
Fig. 2.
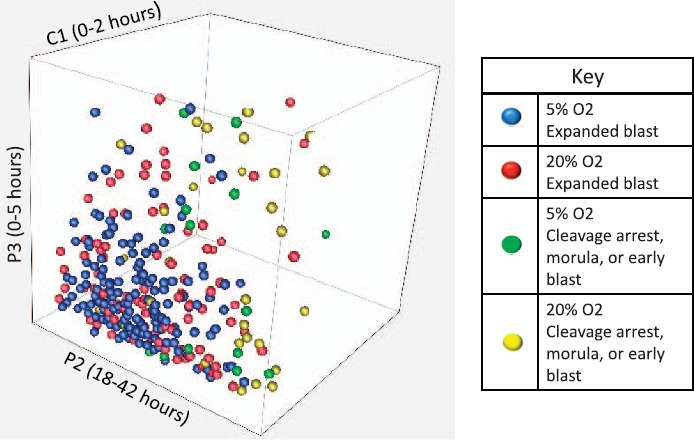
Three-dimensional plot of C1, P2, and P3 in 20% and 5% O2 by embryo morphology on Day 4 of culture. Each dot represents one embryo. Axes (not shown) are in hours.
Official websites use .gov
A
.gov website belongs to an official
government organization in the United States.
Secure .gov websites use HTTPS
A lock (
) or https:// means you've safely
connected to the .gov website. Share sensitive
information only on official, secure websites.
Three-dimensional plot of C1, P2, and P3 in 20% and 5% O2 by embryo morphology on Day 4 of culture. Each dot represents one embryo. Axes (not shown) are in hours.