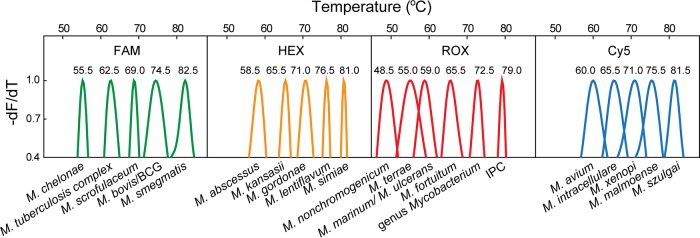
FIG 1.
Melting peaks for each species in the MeltPro Myco assay in line with the 2D label strategy. To visually compare the melting temperature values of different Mycobacterium species, the melting curves showing the negative derivative of fluorescence intensity with respect to temperature were first normalized between 0 and 1, and then the data between 0.4 and 1 were plotted.

