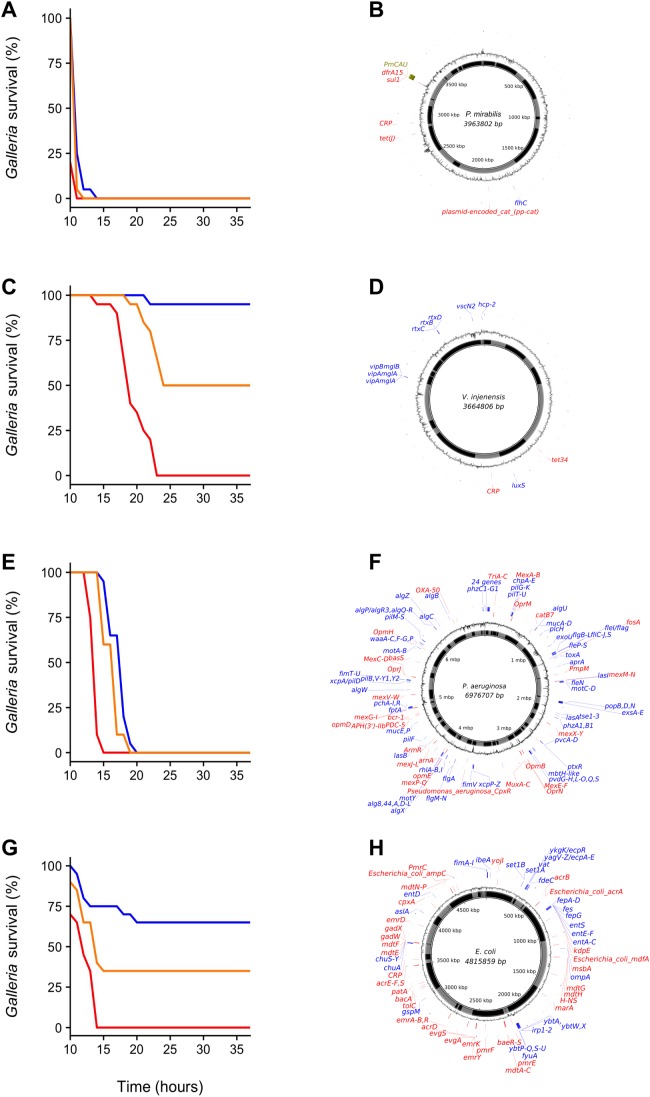
Figure 2. Galleria survival curves and whole-genome sequence representations of four pathogenic bacterial isolates.
(A, C, E and G) Galleria mellonella mortality after inoculation with individual bacterial clones originally isolated from G. mellonella larvae infected with environmental (whole-bacterial community) samples. Groups of 20 Galleria larvae were inoculated with 10 μL of 1 × 10² CFU (blue), 1 × 10⁴ CFU (orange) and 1 × 10⁶ CFU (red). (B, D, F and H) show clone-genome information (species name and genome size (middle), contigs (inner ring; gray and black), GC content (outer ring), virulence genes (blue) and ARGs (red) (≥75% nucleotide similarity used for Proteus mirabilis and V. injenesis; ≥90% similarity used for Pseudomonas aeruginosa and E. coli; ≥80% coverage criterion for all four species). Galleria mellonella mortality after inoculation with Proteus mirabilis (LD50 = 1 × 10² CFU) (A) and its genome (the genomic island SGI1-PmCAU is indicated in green) (B); Galleria mellonella mortality after inoculation with Vibrio injenensis (LD50 = 1 × 10⁶ CFU) (C) and its genome (note that the absence of a closed draft genome means that contigs are randomly ordered) (D); Galleria mellonella mortality after inoculation with Pseudomonas aeruginosa (LD50 = 1 × 10² CFU) (E) and its genome (F); Galleria mellonella mortality after inoculation with Escherichia coli (LD50 = 1 × 10⁴ CFU) (G) and its genome (H).

