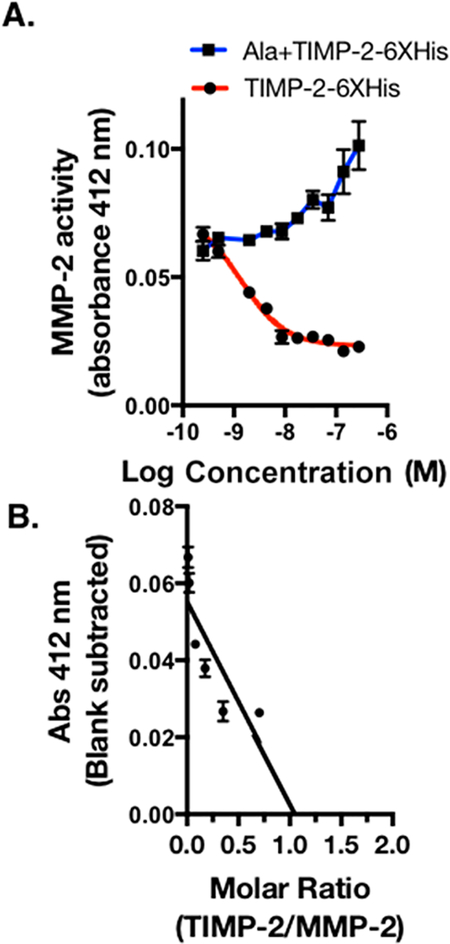
Figure 6.
Inhibition of MMP-2 activity by rhTIMP-2-6XHis and Ala +TIMP-2 was monitored by colorimetric product formation at 412 nm. (A) MMP-2 enzymatic activity data plotted vs log molar concentration of rhTIMP-2-6XHis (red) and Ala+TIMP-2 (blue) were fitted to a nonlinear curve for the one-site enzyme inhibitor response. (B) Data from the linear range of the rhTIMP-2-6XHis inhibition curve were analyzed by linear regression analysis and extrapolation to the X-axis to estimate the molar ratio of rhTIMP-2-6XHis to MMP-2, resulting in complete inhibition of MMP-2 enzymatic activity (n = 3; mean ± standard error of the mean).

