
Figure 3.
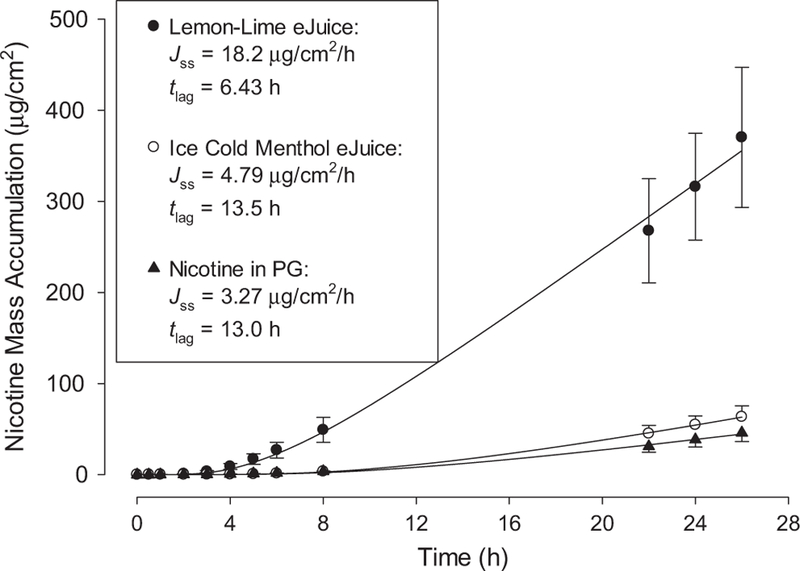
Representative infinite dose mass accumulations for surrogate and commercial e-liquids. Symbols represent means and SDs of three skin discs from one human donor. One sided error bars on lower plots are for clarity. Solid lines are regressions with Eq. (1); resulting parameter values for Jss and tlag are listed.