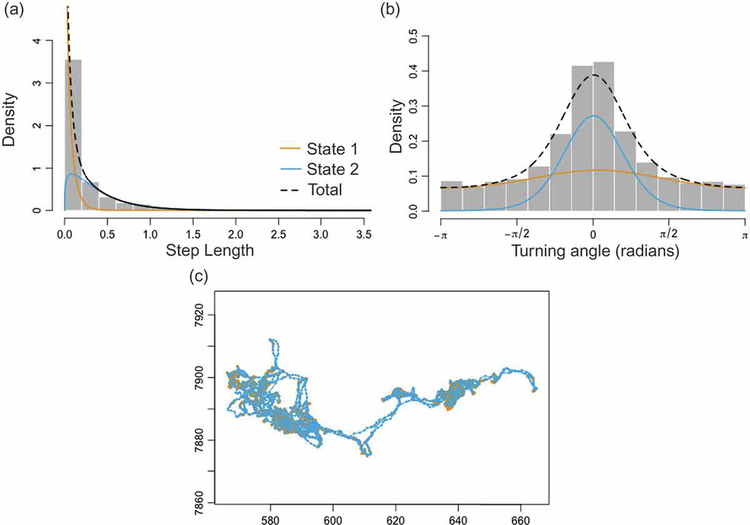
Figure 1.
Results of a “2-state, no-covariate” behavioral model of zebra “AG256” using the moveHMM package in R (see supplementary files for data and code). This analysis assumed 2 distinct behavioral states and included only an intercept term, no environmental or other physiological covariates were included. Panels (a) & (b) show the empirical distributions of step lengths and turning angles respectively, using yellow and blue lines to depict the estimated distributions in each behavioral state. Panel (c) displays the particular trajectory used to produce distributions (a) and (b), with each color-coded with respect to their predicted behavioral state: yellow for state 1 and blue for state 2. Data exploration and biological knowledge of the observed individual is necessary to determine whether a model with more than two states clarifies or muddies interpretation of what each state is likely to represent. In our example, it seems probable, given the relatively uniform distribution of turning angles and the high density of short steps, that State 1 represents bouts of foraging while State 2 represents more directed movement behavior (e.g., travel; notice the apparently unbiased distribution of turning angles and larger step sizes).

