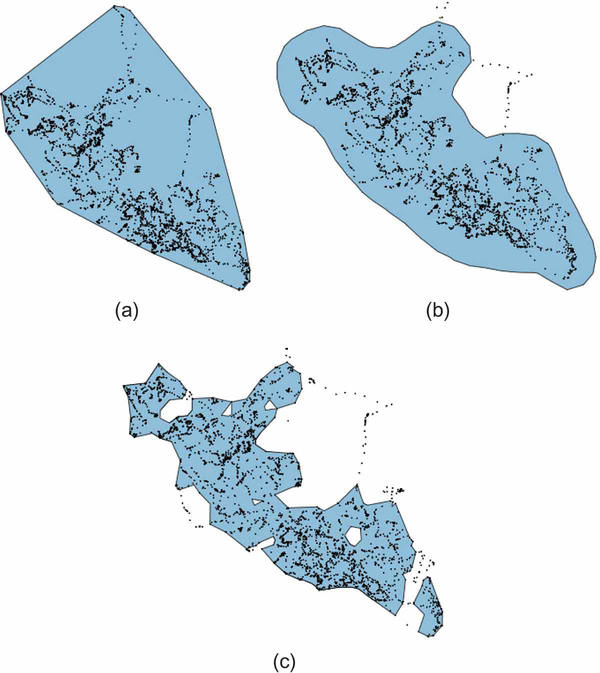
Figure 2.
Comparative home range estimates for zebra “AG256” (using only the data that pertains to the western part of its total range—cf. Panel (c) in Fig. 1) across 3 static (i.e., time-integrated) techniques. The simplest technique, a minimum convex polygon (MCP), displayed in Panel (a), defines the extent of a home range as the smallest convex polygon fitting a given percentage of points. Though still used widely, MCPs are criticized as poor estimators of an animal’s true home range because they often contain large areas unused, and potentially unavailable, to the observed individual, as evident in the upper-center of our trajectory. Panel (b) displays a common alternative: the 95% kernel utilization distribution. This method was developed to more rigorously quantify an animals actual space use and ultimately defines an animal’s home range as a bivariate probability density function, calculating the probability of relocating an animal in any given location (Worton 1989). Panel (c) offers a non-parametric approach, calculating the home range of the zebra using a-LoCoH, the adaptive local convex hull method developed by Getz et al. (2007) that constructs kernels at each relocation using all points within a total distance a such that the distances of all neighboring points to the reference point sum to a value less than or equal to a. In our example, we used a = 75000 m, which provided a contiguous range that trades-off fewer false positives at the expense of more false negatives than the other two methods. There is much debate and continued development in the area of home-range estimation and researchers must be conscious of the differences across metrics, because results often vary widely and may offer different biological interpretations (e.g., defining the extent of the habitat available to the animal for selection versus the area traversed in daily activity; see Fieberg and B¨orger 2012). For more detail on the construction of these three home range measures, see Appendix B.

