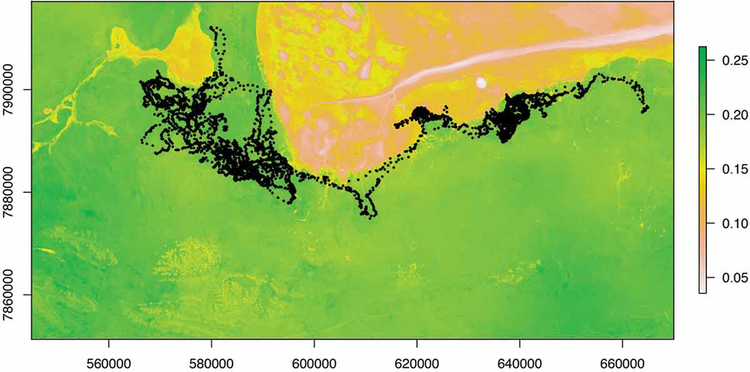
Figure 3.
Predicted habitat selection using a step-selection function for zebra “AG256”. Fundamentally, selection functions calculate the selection ratio of any given resource unit by comparing characteristics of “used” units to those “available” to the animal, typically using a logistic regression framework. Step-selection functions differ from traditional RSFs by defining what is “available” according to randomly drawn steps from each point rather than a simple random sample of the home range as a whole. Here we display AG256’s predicted selection ratio for a portion of Etosha National Park according to 4 environmental layers: distance to primary roads, distance to functional water sources, mean greenness, and mean wetness. On top of the predicted selection layer, the original trajectory is plotted in black. Note that only the western part of the trajectory, which occurs during the wet season (Zidon et al. 2017), is used to construct the home ranges depicted in Fig. 2). For a complete discussion of the regression and details regarding the selection of available steps and the environmental layers used, please see Appendix B.

