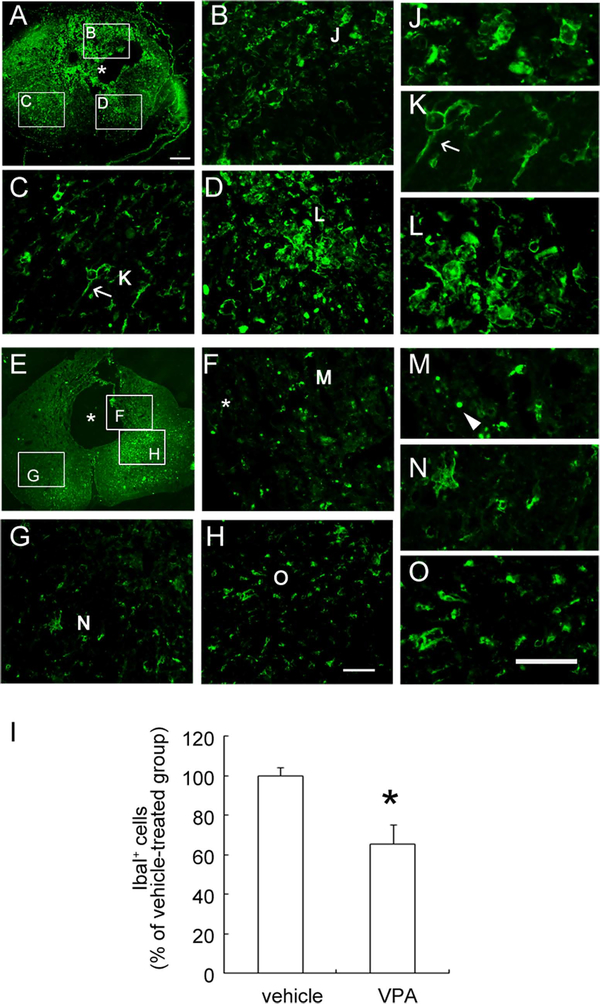
Fig. 2.
Immunofluorescence of Iba1 in the injured spinal cord. The cross-sections of the spinal cord collected at day 31 post-SCI 1–2 mm proximal to the epicenter were subjected to immunofluorescence for Iba1. Iba1+ microglia/macrophages had accumulated in the lesion center (LC) of the vehicle-treated spinal cord (A–D). Most Iba1+ microglia/macrophages in the LC displayed an amoeboid shape (J,L), and some cells showed a hypertrophic, ramified form (K, arrow). Fewer Iba1+ microglia/macrophages were observed in the injured spinal cord of VPA-treated rats (E–H,M–O). Iba1+ tissue debris was found in VPA-treated spinal cord tissue near the cavity (F, arrowhead in M). Many Iba1+ cells displayed a hypertrophic morphology (G,H). Higher magnifications of the areas indicated in G and H are shown in N and O. Iba1+ microglia observed in these regions were quantified (I). Data shown in I are presented as mean ± SEM and are expressed as Iba1+ cells per cross-section (n = 3 rats). *P < 0.05 vs. vehicle. Asterisks in A, E, and F indicate the tissue cavity. Scale bars = 200 μm in A (applies to A,E); 50 μm in H (applies to B–D,F–H); 50 μm in O (applies to J–O). [Color figure can be viewed in the online issue, which is available at wileyonlinelibrary.com.]

