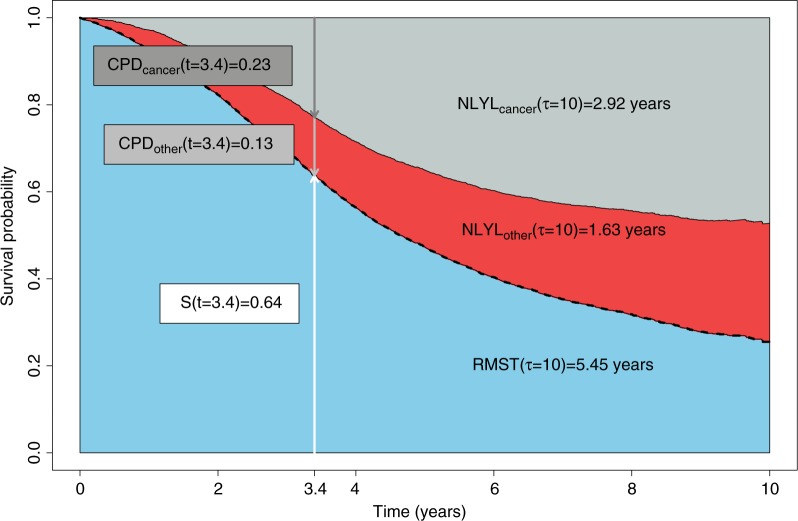
Figure 1.
Graphical representation of the different measures using simulated data: the overall survival probability (dashed black curve), the 10-year RMST (lower shaded area), the NLYL at 10 years according to each cause (NLYLcancer – upper shaded area and NLYLother – middle shaded area, which sum up to give the RMTL), and the curves of the CPD due to cancer (CPDcancer) and due to other causes (CPDother), using a (reverse) stacked display format.
Note: Simulated data were used for this graphical representation; therefore, the values do not match the estimated values from the manuscript (which were based on real data).
Abbreviations: CPD, crude probability of death; NLYL, number of life years lost; RMST, restricted mean survival time; RMTL, restricted mean time lost.

