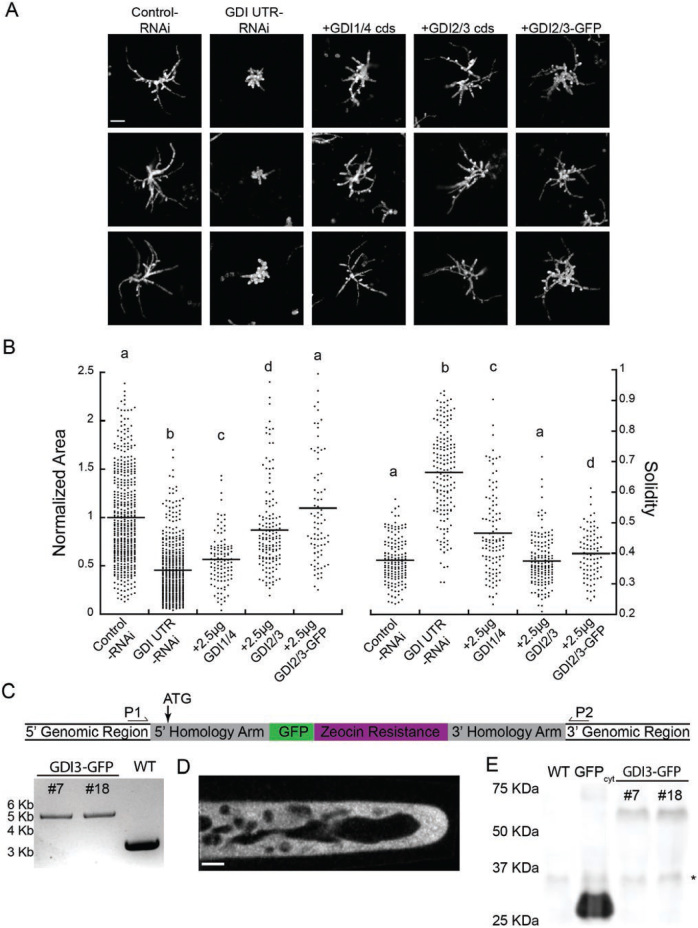
Fig. 3.
RopGDI2/3 rescues the RopGDI-RNAi phenotype. (A) Representative images of chlorophyll autofluorescence of 7-d-old plants expressing the indicated constructs. Complementation was performed by transforming 30 μg of the GDI UTR RNAi plasmid together with 2.5 μg of the indicated plasmid. The scale bar is 100 μm. (B) Quantification of plant area and solidity. Area is normalized to the average size of plants transformed with the control plasmid, and the means are indicated by horizontal lines. Different letters indicate groups with significantly different means as determined by ANOVA with a Tukey post hoc test (α=0.05). (C) Diagram of the modified GDI3-mEGFP locus (not to scale), with location of genotyping primers and start codon (ATG) indicated, And the results of genotyping the modified locus in two independent stable transgenic lines together with a wildtype (WT) control. An amplicon produced across the modified locus is 5620 bp, compared to 3339 bp in the WT. (D) Single-focal-plane confocal image of GDI3-mEGFP localization. The scale bar is 5 μm. (E) Western blot of GDI3-mEGFP lines, with WT and cytosolic GFP extracts as controls. The asterisk indicates a non-specific band detected with the GFP primary antibody.

