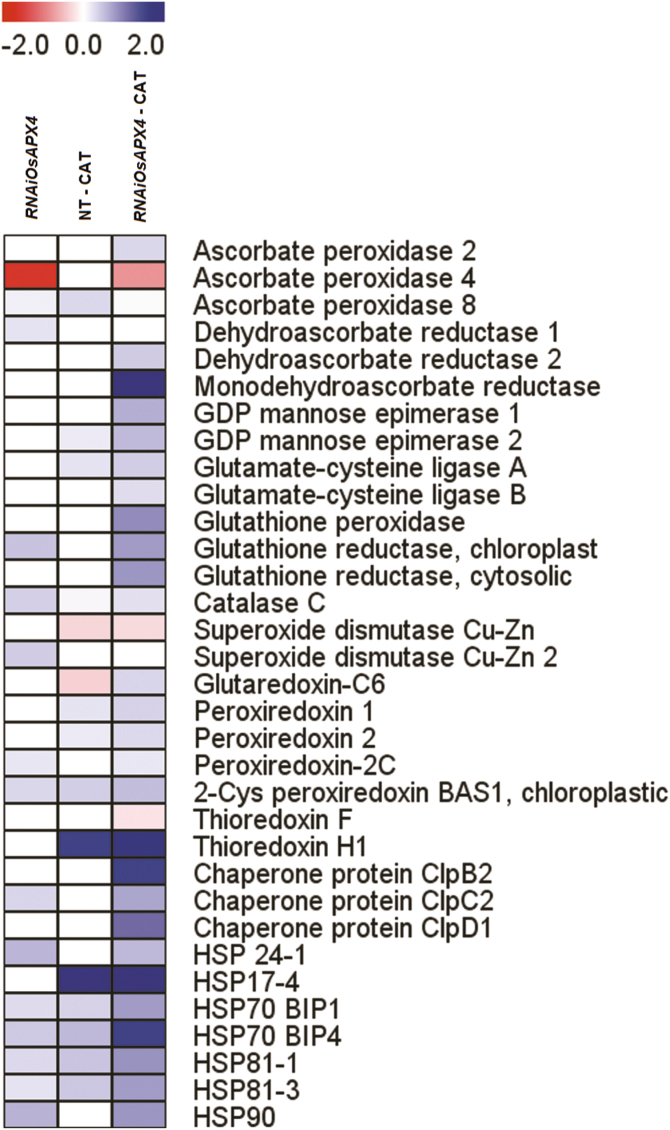
Fig. 8.
Heatmap of differently expressed proteins related to stress metabolism in leaves of OsAPX4-RNAi plants, and in OsAPX4-RNAi and non-transformed (NT) plants treated with 10 mM of the catalase-inhibitor 3-AT (–CAT), all compared to the protein abundances in NT control plants. The fold-changes as assessed by proteomic analysis were plotted as a heatmap using the MEV software framework. The scale is based on a range from –2 to +2 on a log2 scale.

