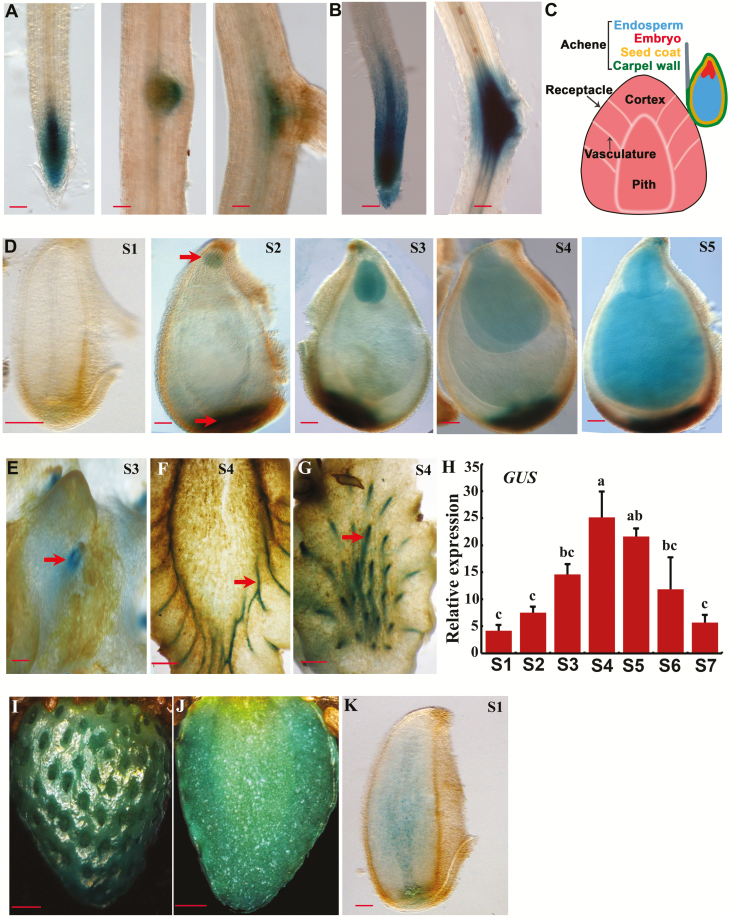
Fig. 1.
DR5ver2::GUS expression in roots and fruit of F. vesca. (A) GUS expression of the DR5ver2::GUS reporter lines in root. (B) GUS expression in root after NAA (100 μM) treatment. (C) Diagram of strawberry fruit showing the receptacle and an achene. The achene consists of embryo, ghost (endosperm and seed coat), and the ovary wall. (D) GUS expression of DR5ver2::GUS in ovule (stage 1) and seeds at stages 2–5. Arrows indicate embryo (top) and chalazal seed coat (bottom). (E–G) GUS expression of DR5ver2::GUS in receptacle. (E) Surface of the receptacle at stage 3. Arrow indicates the region where achene is attached to the receptacle. (F, G) Different sections of the receptacle at stage 4. Arrows indicate the vasculatures in sectioned receptacle fruit. (H) Expression level of GUS obtained by qRT-PCR in the receptacle of the DR5ver2::GUS reporter line at stages 1–7. Gene11892 was used as the internal control. Data are means ±SD obtained from three biological replicates. Significant differences at the P<0.05 level are indicated by different letters, tested by Tukey’s test. (I–K) GUS staining in receptacle (I, J) and ovule (K) at 5 and 2 d post-NAA (500 μM) treatment. Scale bars: 10 µm (A, B, D, K); 100 µm (E); 2 mm (F, G, I, J).

