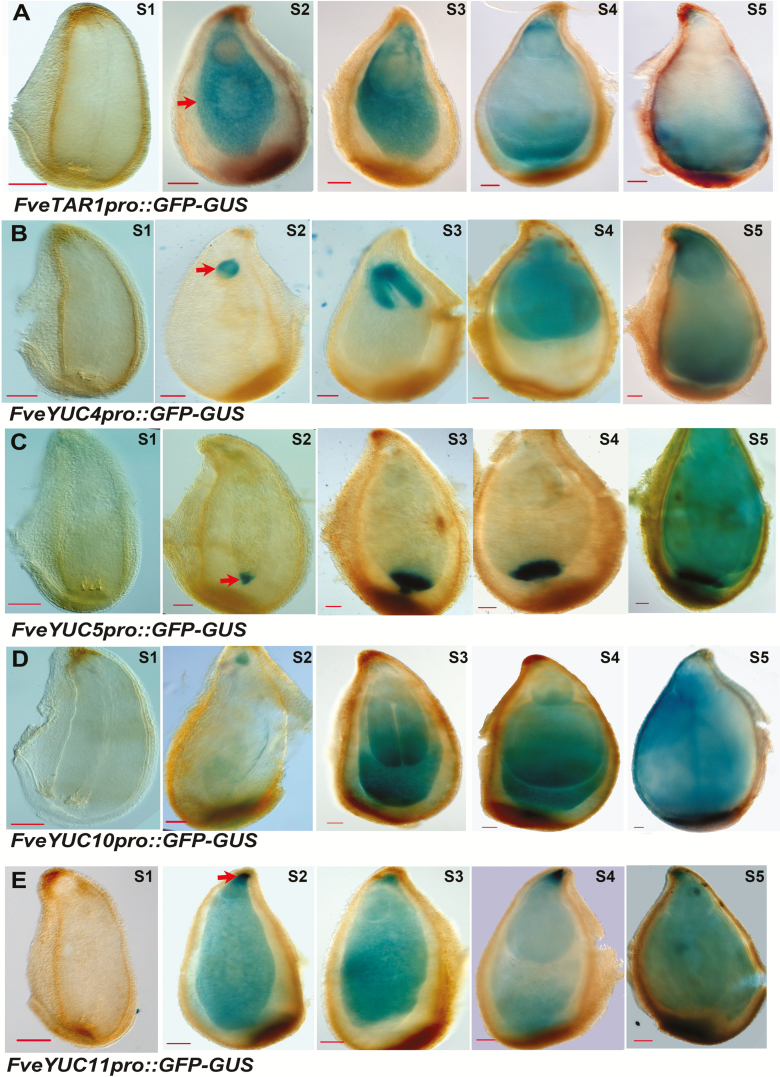
Fig. 3.
Expression pattern of FveTARs and FveYUCs in seeds. (A–E) GUS expression of the FveTAR1pro::GFP-GUS (A), FveYUC4pro::GFP-GUS (B), FveYUC5pro::GFP-GUS (C), FveYUC10pro::GFP-GUS (D), and FveYUC11pro::GFP-GUS (E) reporter lines in stage 1 ovule and stages 2–5 seed, respectively. Arrows indicate endosperm (A), embryo (B), chalazal endosperm (C), and the micropylar pole of the seed (E). Scale bars: 10 µm (A–E).

