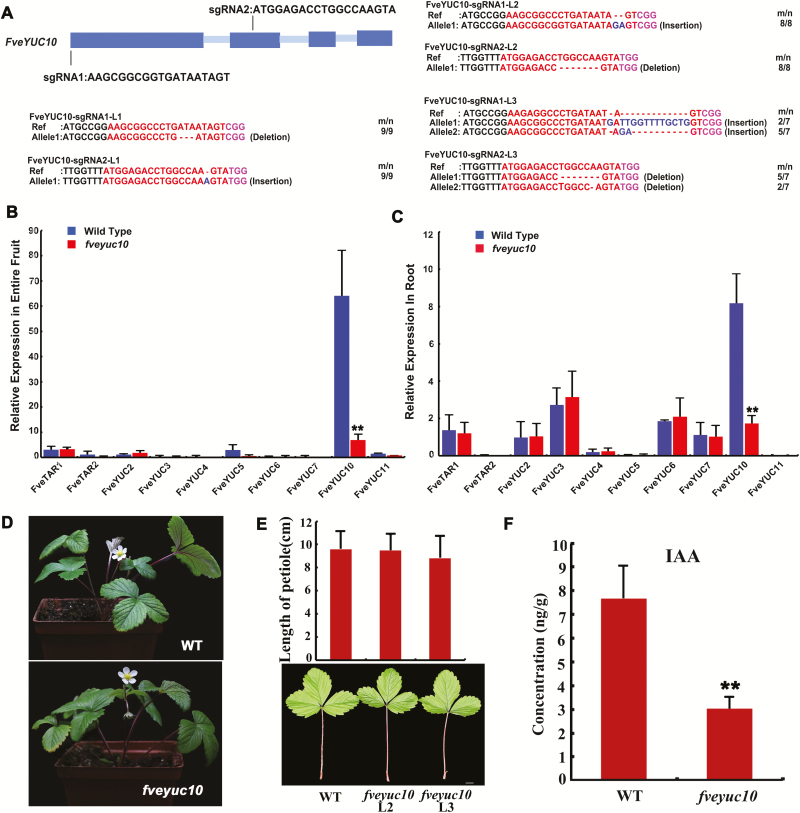
Fig. 5.
Characterization of the fveyuc10 mutants created by CRISPR/Cas9. (A) Genotyping of the three FveYUC10-CRISPR lines (L1–3) in the T0 generation. The protospacer adjacent motif sequence is indicated with magenta. The sgRNA is indicated with red. The mutation sites are indicated with blue. For the term m/n, n indicates the number of clones examined, and m indicates the number of clones showing the indicated genotype. (B) Expression level of FveTARs and FveYUCs in fruit (stage 4) of wild type and fveyuc10 (L3) obtained by qRT-PCR. (C) Expression level of FveTARs and FveYUCs in roots of wild type and fveyuc10 (L3) obtained by qRT-PCR. Gene11892 was used as the internal control. Data are means ±SD obtained from three biological replicates. (D) Morphology of wild type and the fveyuc10 (L3) mutant at the same age. (E) Morphology and length of leaves of wild type and fveyuc10 mutants (L2 and L3). Scale bar: 1 cm. No significant difference was found by Student’s t-test (n=21, 39, and 45 respectively). (F) Free auxin content in fruit of wild type and fveyuc10 (L2 and L3 pooled together) at stage 4. **P<0.01, Student’s t-test, n=4.

