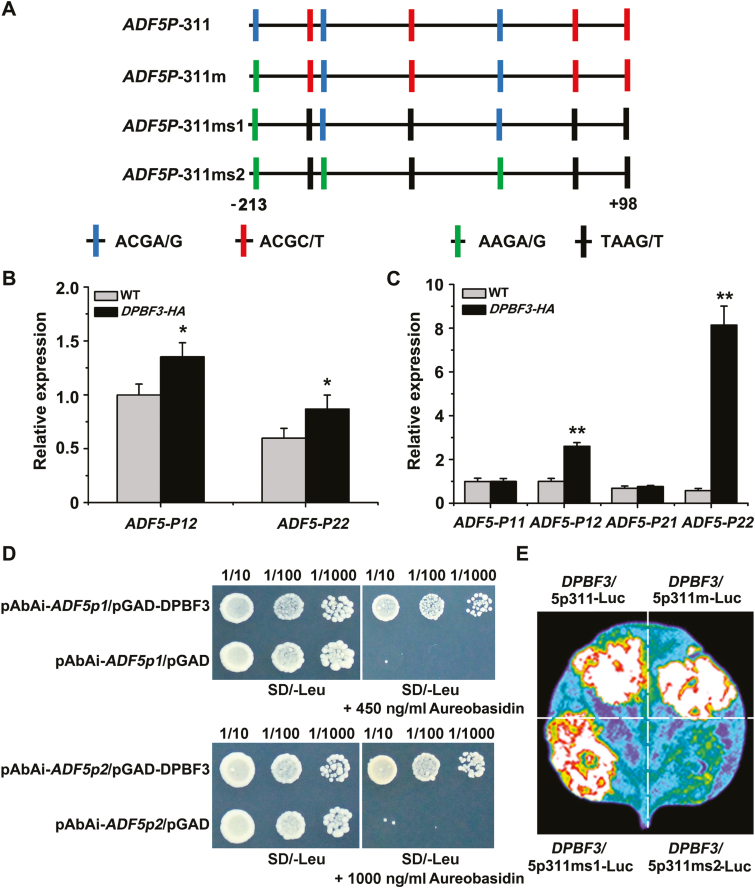
Fig. 6.
DPBF3 binds directly to the ADF5 promoter and activates ADF5 expression. (A) Schematic diagram of the motifs in the ADF5 promoter. ADF5p311 indicates the 311 bp region downstream of the ADF5 promoter, and ADF5p311m indicates the change from ACGA/G to AAGA/G at position –203 to –206 bp. Similarly, ADF5p311ms1 indicates the change from ACGC/T to TAAG/T at positions –5 to –78 bp, –147 to –150 bp, +44 to +47 bp, and +94 to +97 bp; and ADF5p311ms2 indicates the change from ACGC/T to TAAG/T at positions –75 to –78 bp, –147 to –150 bp, +44 to +47 bp, and +94 to +97 bp, and the change from ACGA/G to AAGA/G at positions –1 to –4 bp, –135 to –138 bp, and –203 to –206 bp. (B) ChIP analysis of the interaction between DPBF3 and the ADF5 promoter under normal conditions. Fragment P12 localizes to –10 to +55 bp and P22 localizes to –200 to –270 bp of the ADF5 promoter. (C) ChIP analysis of the interaction between DPBF3 and the ADF5 promoter after treatment with 40 μM ABA. Fragment P11 localizes to +75 to +98 bp and P21 localizes to –500 to –635 bp of the ADF5 promoter. Data presented are the mean ±SD of three independent biological replicates. *P<0.05, **P<0.01 (Student’s t-test). (D) Y1H assay of the interaction between DPBF3 and the ADF5 promoter, showing the growth of yeast cells on 450 and 1000 ng ml–1 aureobasidin A-SD/Leu medium. Cells were grown in liquid medium to an OD600 of 1.0. The numbers above the images indicate the dilutions. (E) DPBF3 could activate the expression of ADF5 when transiently expressed in tobacco leaves.

