FIGURE 1.
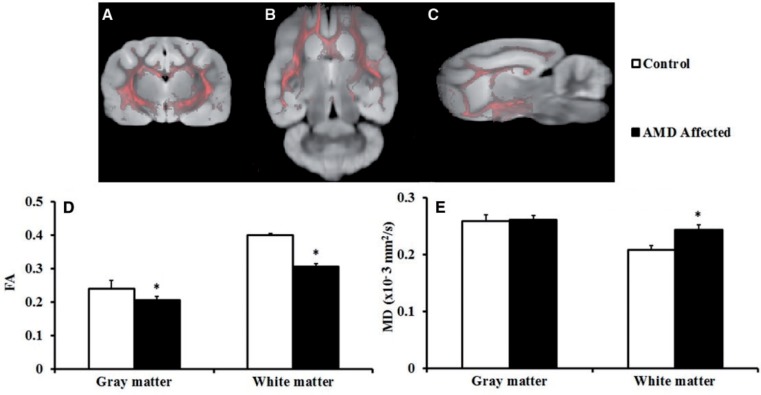
Segmentation of gray and white matter from whole brain. (A–C) Pink color represents white matter; gray color represents gray matter. Image orientations are axial (A), sagittal (B), and coronal (C). (D, E) Bar graphs demonstrate average ex vivo diffusion tensor imaging-derived fractional anisotropy (FA) and mean diffusivity (MD) values from gray and white matter of the α-mannosidosis (AMD)-affected and normal control cat brains. *p < 0.05. Error bars represent ± SE.

