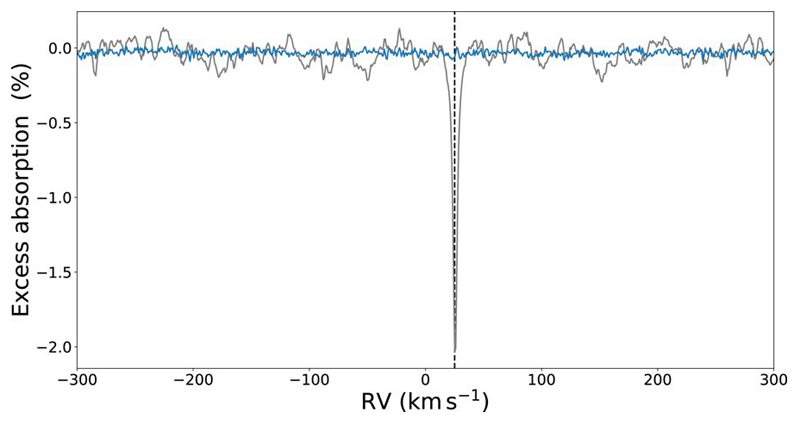
Extended Data Fig. 1.
Telluric water-absorption correction. Crosscorrelation analysis performed on the in-transit spectrum with a telluric water-absorption template spectrum (at 296 K). The blue and grey curves are the transit depths with and without the telluric correction, respectively. The data are shifted to the rest frame of the star, such that the signal dominated by telluric water absorption occurs near +25 km s−1 (corresponding to the barycentric Earth radial velocity (BERV) systemic velocity), as indicated by the dashed vertical line.

