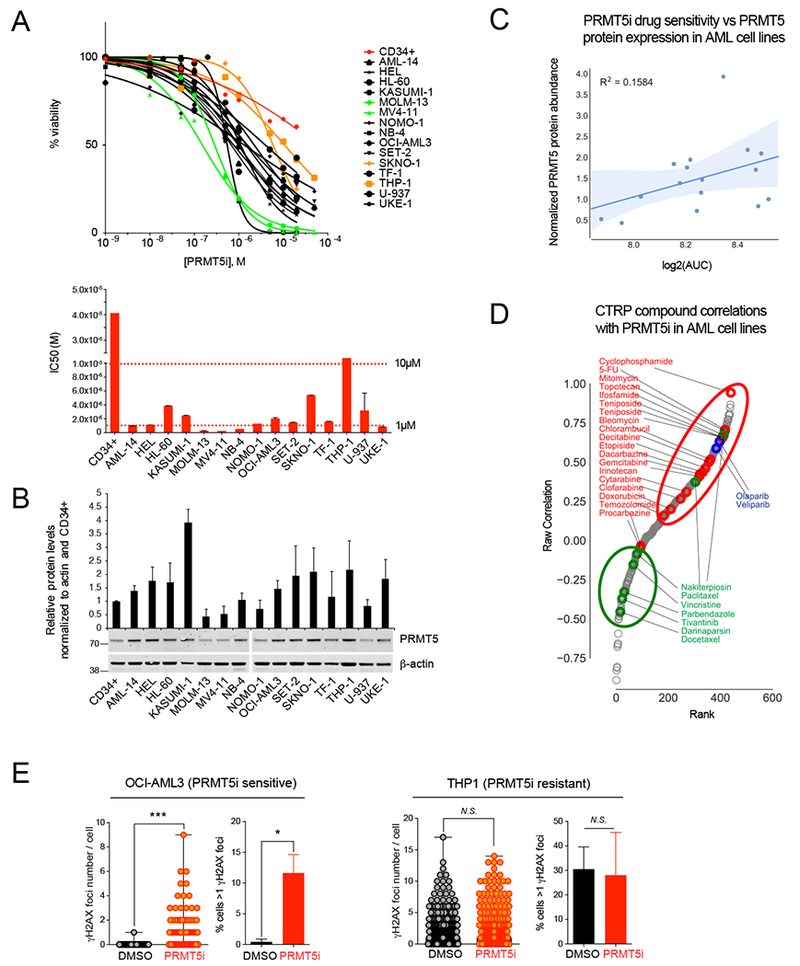
Figure 1. PRMT5 inhibition correlates with impaired DNA repair and increased DNA damage in leukemia cell lines.

(A) Top: Viability assay at day 5 for 15 AML cells lines (the 2 most sensitive and resistant cell lines are labeled in green and in orange, respectively) and normal human cord blood derived CD34+ cells (red) treated with increasing doses of PRMT5 inhibitor (PRMT5i) GSK3186000A. Bottom: graphical depiction of the IC50 of GSK3186000A for the panel of cell lines.
(B) Immunoblot with PRMT5 and β-actin antibodies and quantification of PRMT5 relative abundance within all tested cell lines.
(C) Plot of PRMT5i drug sensitivity vs PRMT5 protein expression in AML cell lines showing no significant correlation (R2 = 0.1584, P=0.13).
(D) Distribution of PRMT5i and CTRP compound sensitivity Spearman correlations in AML cell lines showing a positive correlation between PRMT5i and genotoxic agents (red, P=0.0089) as well as PARP1/2 inhibitors (blue, P=0.016), and a negative correlation between PRMT5i and microtubule poisons (green, P=0.02).
(E) Quantification of the number of γH2AX foci per cell and the percent of cells with >1 γH2AX foci by immunofluorescence analysis performed with antibody to γH2AX in leukemia cell lines treated with GSK3186000A (IC50 dose (μM) for 4 days) showing increased DNA damage in OCI-AML3 cells (sensitive to PRMT5i) and in THP1 cells (not sensitive). Error bars indicate the SEM of 3 biological replicates. *** P<0.0001, * P<0.05.
See also Table S2.
