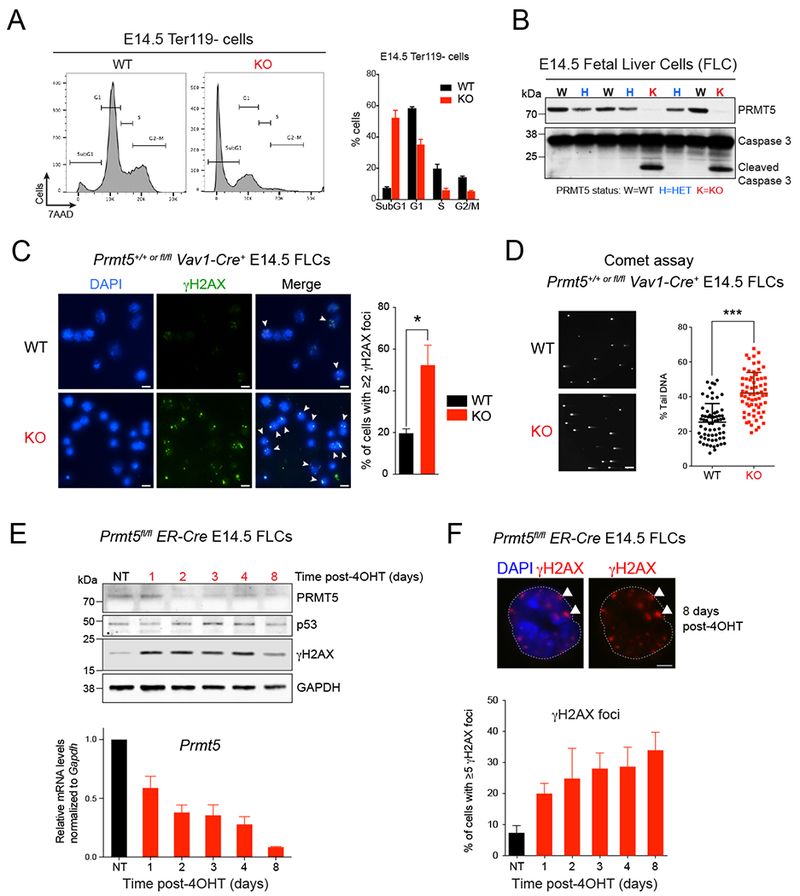
Figure 2. PRMT5 depletion leads to DNA damage accumulation.

(A) Flow cytometry with fixed E14.5 fetal liver cells (FLCs) showing a substantial increase in subG1 population in KO cells compared to WT. Cells were gated on the Ter119− subset. The percent of cells in subG1, G1, S, and G2/M phases of the cell cycle were quantified and are shown on the right. Error bars indicate the SEM of 3 biological replicates.
(B) Immunoblot with PRMT5 and Caspase 3 antibodies showing increased Caspase 3 cleavage in PRMT5 KO whole FLCs at E14.5.
(C) Immunofluorescence analysis performed with antibody to γH2AX in PRMT5 WT vs KO E14.5 FLCs. Left: representative pictures. Right: quantification of the percent of cells showing γH2AX foci staining. Scale bar, 10μm. White arrows point to γH2AX foci. Error bars indicate the SEM of 3 biological replicates. * P<0.05.
(D) Neutral COMET assay performed in PRMT5 WT vs KO E14.5 FLCs. A representative field showing increased percent tail DNA in KO cells is showed on the left and the quantification for 100 cells is showed on the right. Scale bar, 20 μm. *** P<0.0001
(E) Top: Immunoblot with PRMT5, p53 and γH2AX antibodies in Prmt5fl/fl;ER-Cre E14.5 FLCs treated with 1μM 4-Hydroxytamoxifen (4-OHT) for 8 days. Bottom: Corresponding qRT-PCR analysis showing decreasing levels of Prmt5 upon 4-OHT treatment. Error bars indicate the SEM of 3 biological replicates.
(F) Immunofluorescence analysis performed with antibody against γH2AX in Prmt5fl/fl;ER-Cre E14.5 FLCs treated with 1μM 4-OHT for 8 days. Top: representative pictures. Scale bar, 5 μm. White arrows point to γH2AX foci. Bottom: quantification of the percent of cells with ≥5 γH2AX foci. Error bars indicate the SEM of 3 biological replicates.
