
Figure 3. PRMT5 depletion triggers the aberrant splicing of epigenetic factors.
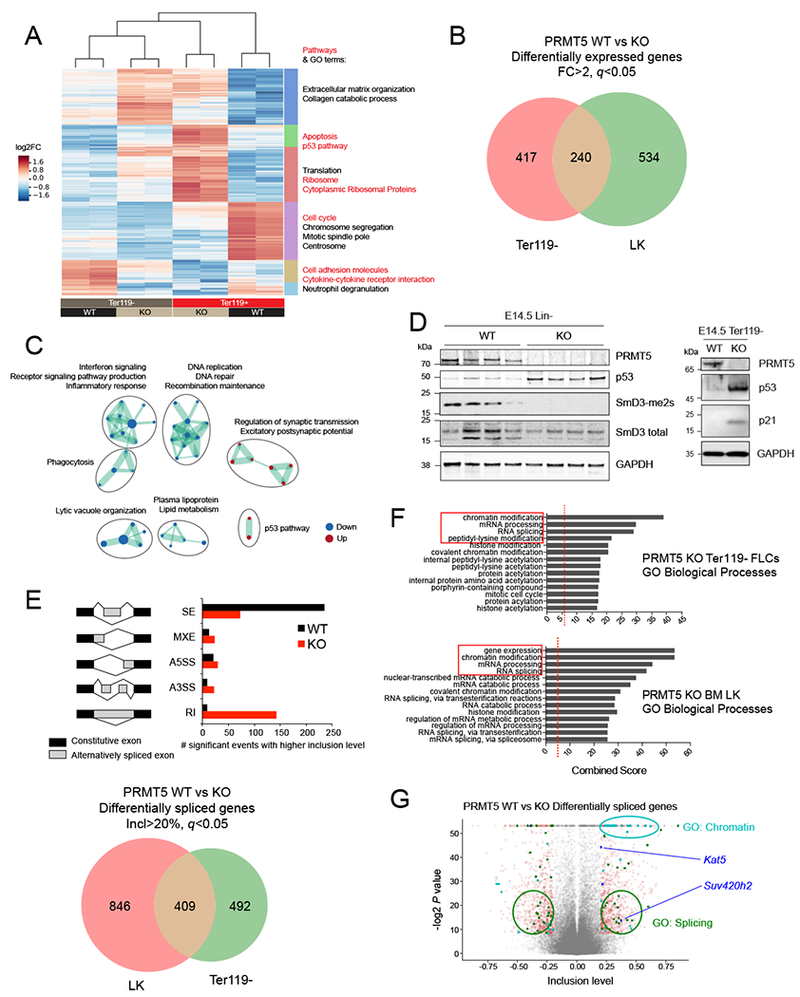
(A) Heat map showing the expression of differentially expressed protein-coding genes in PRMT5 WT (n=2) or KO (n=2) Ter119− or Ter119+ E14.5 FLCs (log2 fold change). On the right are shown the top significant pathways (red) and GO terms (black) determined for 6 clusters defined by differential expression (DE) between WT vs KO and/or Ter119− vs Ter119+ cells.
(B) Venn diagram showing the overlap of differentially expressed genes between adult (LK, lineage-, Kit+, Sea1- cells) and fetal (Ter119− cells) hematopoietic progenitors’ populations. The cutoffs were fold change (FC) >2 and FDR (q value) <0.05.
(C) Gene ontology analysis of overlapping DE genes detected upon PRMT5 depletion in Ter119− and LK cells.
(D) Left: Immunoblot with PRMT5, p53, SmD3-me2s, SmD3 total and GAPDH antibodies showing increased p53 and decreased SmD3 dimethylation in PRMT5 KO lin− E14.5 FLCs. Right: Immunoblot with PRMT5, p53, p21 and GAPDH antibodies showing increased p53 and p21 in PRMT5 KO lin− E14.5 FLCs.
(E) Top: schematic representation of the events detected and number of significant events with higher inclusion levels (inclusion level > 20%) in Ter119− E14.5 FLCs. The MATS algorithm distinguishes the following events: Skipped Exons (SE), Mutually exclusive exons (MXE), Alternative 5’ Splice site selection (A5SS), Alternative 3’ Splice site selection (A3SS), and Retained Intron (RI). The output of the analysis consists of the degree of confidence (FDR and p value) of the differences in ratios between 2 different isoforms. Bottom: Venn diagram showing the overlap of differentially spliced genes between adult (LK cells) and fetal (Ter119− cells) hematopoietic progenitors’ populations.
(F) Gene ontology analysis of all genes whose splicing is affected by PRMT5 loss in LK cells and Ter119− E14.5 FLCs (>20% inclusion level cutoff).
(G) Volcano plot representing all the splicing events detected by MATS. The significant events (p value < 0.05) with an inclusion level >0.2 or <−0.2 are shown in red. Among these, the ones affecting genes that fall in the GO categories Splicing and Chromatin are labeled in green and cyan, respectively. The chromatin modifiers involved in DNA repair are shown in blue (Kat5/Tip60 and Suv420h2).