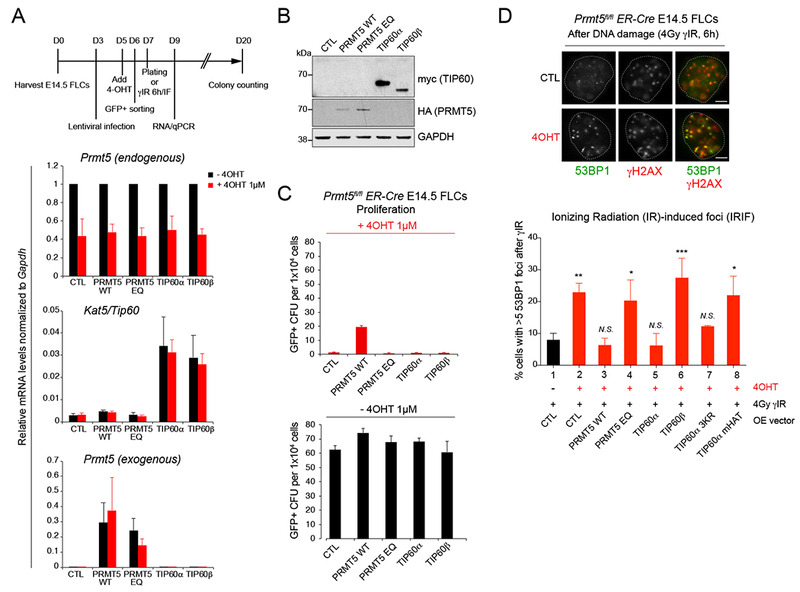
Figure 6. PRMT5 effects on DNA repair are dependent on TIP60/KAT5-mediated histone acetylation.

(A) Top: schematic illustration of experimental design. Bottom: qRT-PCR analysis showing relative mRNA levels of Prmt5 (endogenous and exogenous), and Kat5/TIP60 in Prmt5fl/fl ;ER-Cre E14.5 FLCs −/+ 4-OHT 1μM for 72h retrovirally infected with the corresponding overexpressing GFP+ lentiviral vectors. PRMT5 EQ: enzymatically dead mutant with a E444Q point mutation within PRMT5 methyltransferase enzymatic domain. Error bars are SEM of at least 3 biological replicates.
(B) Immunoblot with myc, HA and GAPDH antibodies in Prmt5fl/fl;ER-Cre E14.5 FLCs overexpressing HA-tagged PRMT5 or myc-tagged TIP60 before 4-OHT treatment.
(C) Quantification of GFP+ colony forming units before (bottom) and after (top) 4-OHT treatment with Prmt5fl/fl;ER-Cre E14.5 FLCs overexpressing the indicating proteins. Error bars are SEM of 3 biological replicates.
(D) Immunofluorescence analysis performed with antibodies against γH2AX and 53BP1 in Prmt5fl/fl;ER-Cre E14.5 FLCs, before (lane 1) and after (lanes 2 to 8) 4-OHT treatment (1μM for 72h), overexpressing HA-tagged PRMT5 WT (lane 3), or enzymatically dead mutant EQ (lane 4), or myc-tagged TIP60α (lane 5), TIP60β (lane 6), TIP60α 3KR (lane 7), and TIP60α enzymatically dead mutant (TIP60 mHAT, lane 8), and treated with 10Gy of gamma ionizing radiation (γIR) for 6h. Top: representative picture of 53BP1 and γH2AX foci in Prmt5fl/fl;ER-Cre E14.5 FLCs before and after treatment with 1 μM 4-OHT, 6h after γIR-induced DNA damage (4Gy). Scale bar, 5 μm. Bottom: Quantification of percent of cells with ≥5 γIR-induced 53BP1 foci from three biological replicates. *P < 0.05, **P < 0.01, ***P < 0.001, N.S., non-significant (one-way ANOVA Tukey’s multiple comparisons test, Adjusted P values).
See also Figure S6.
